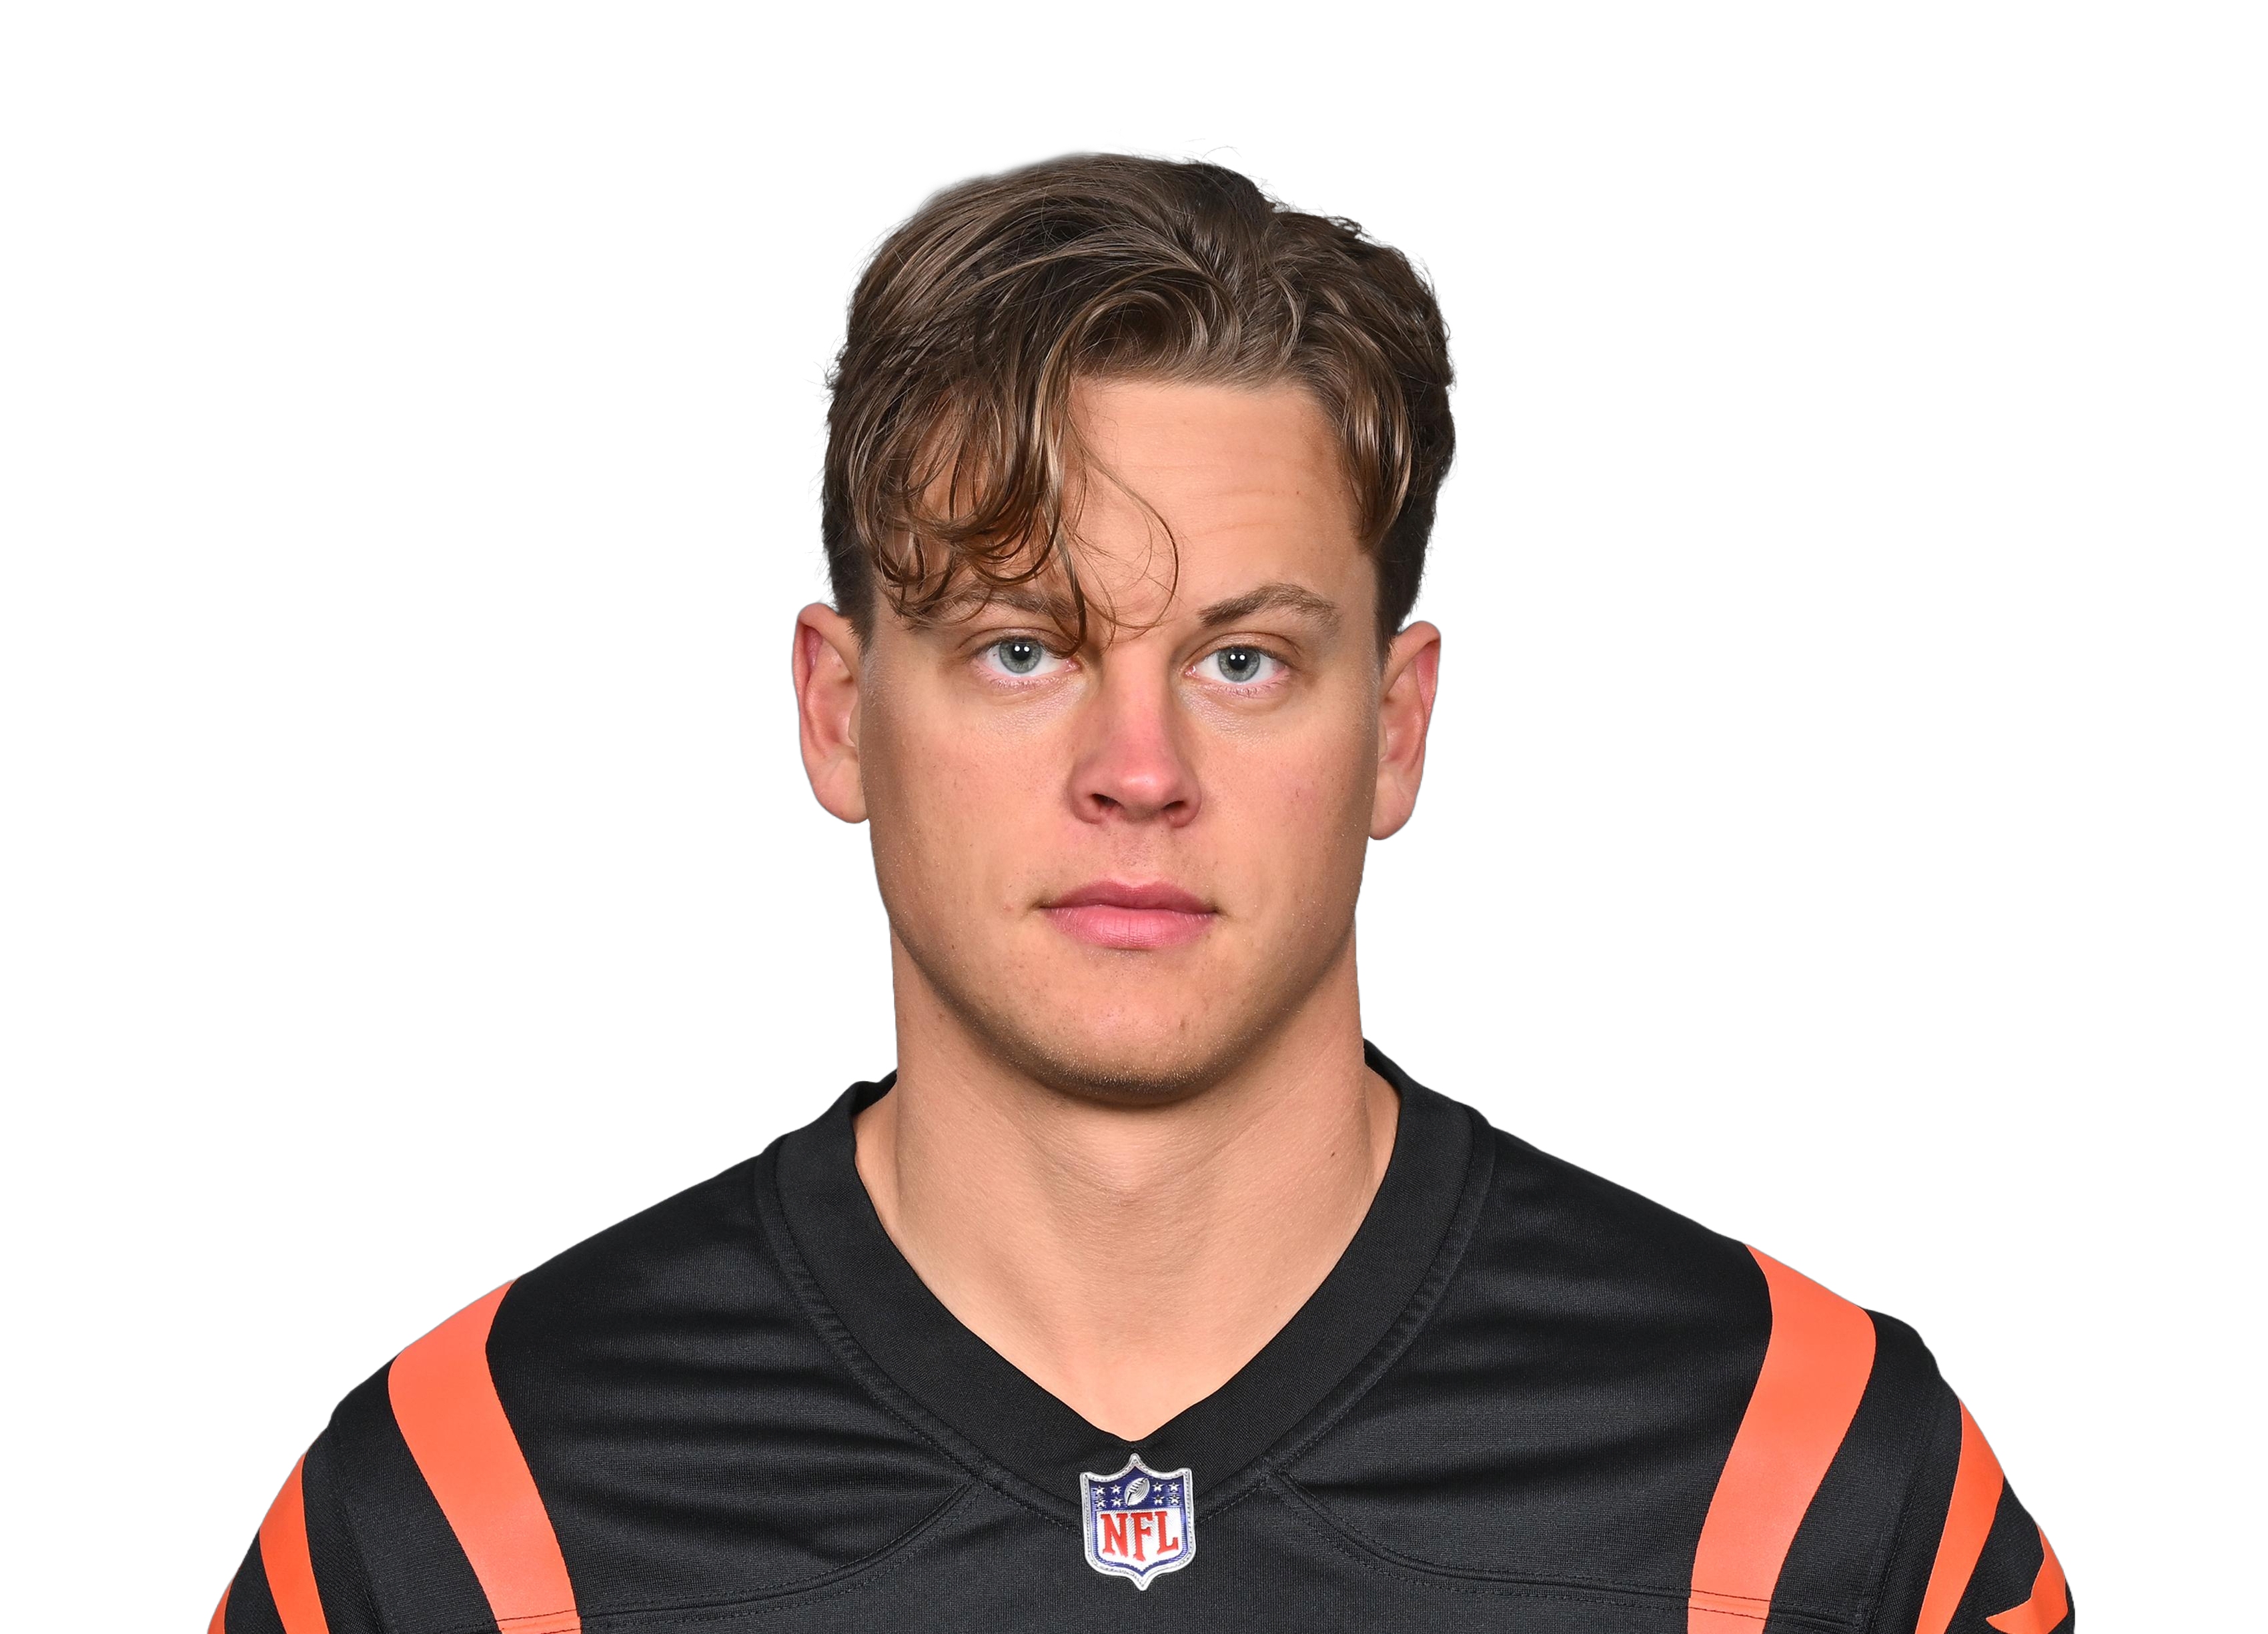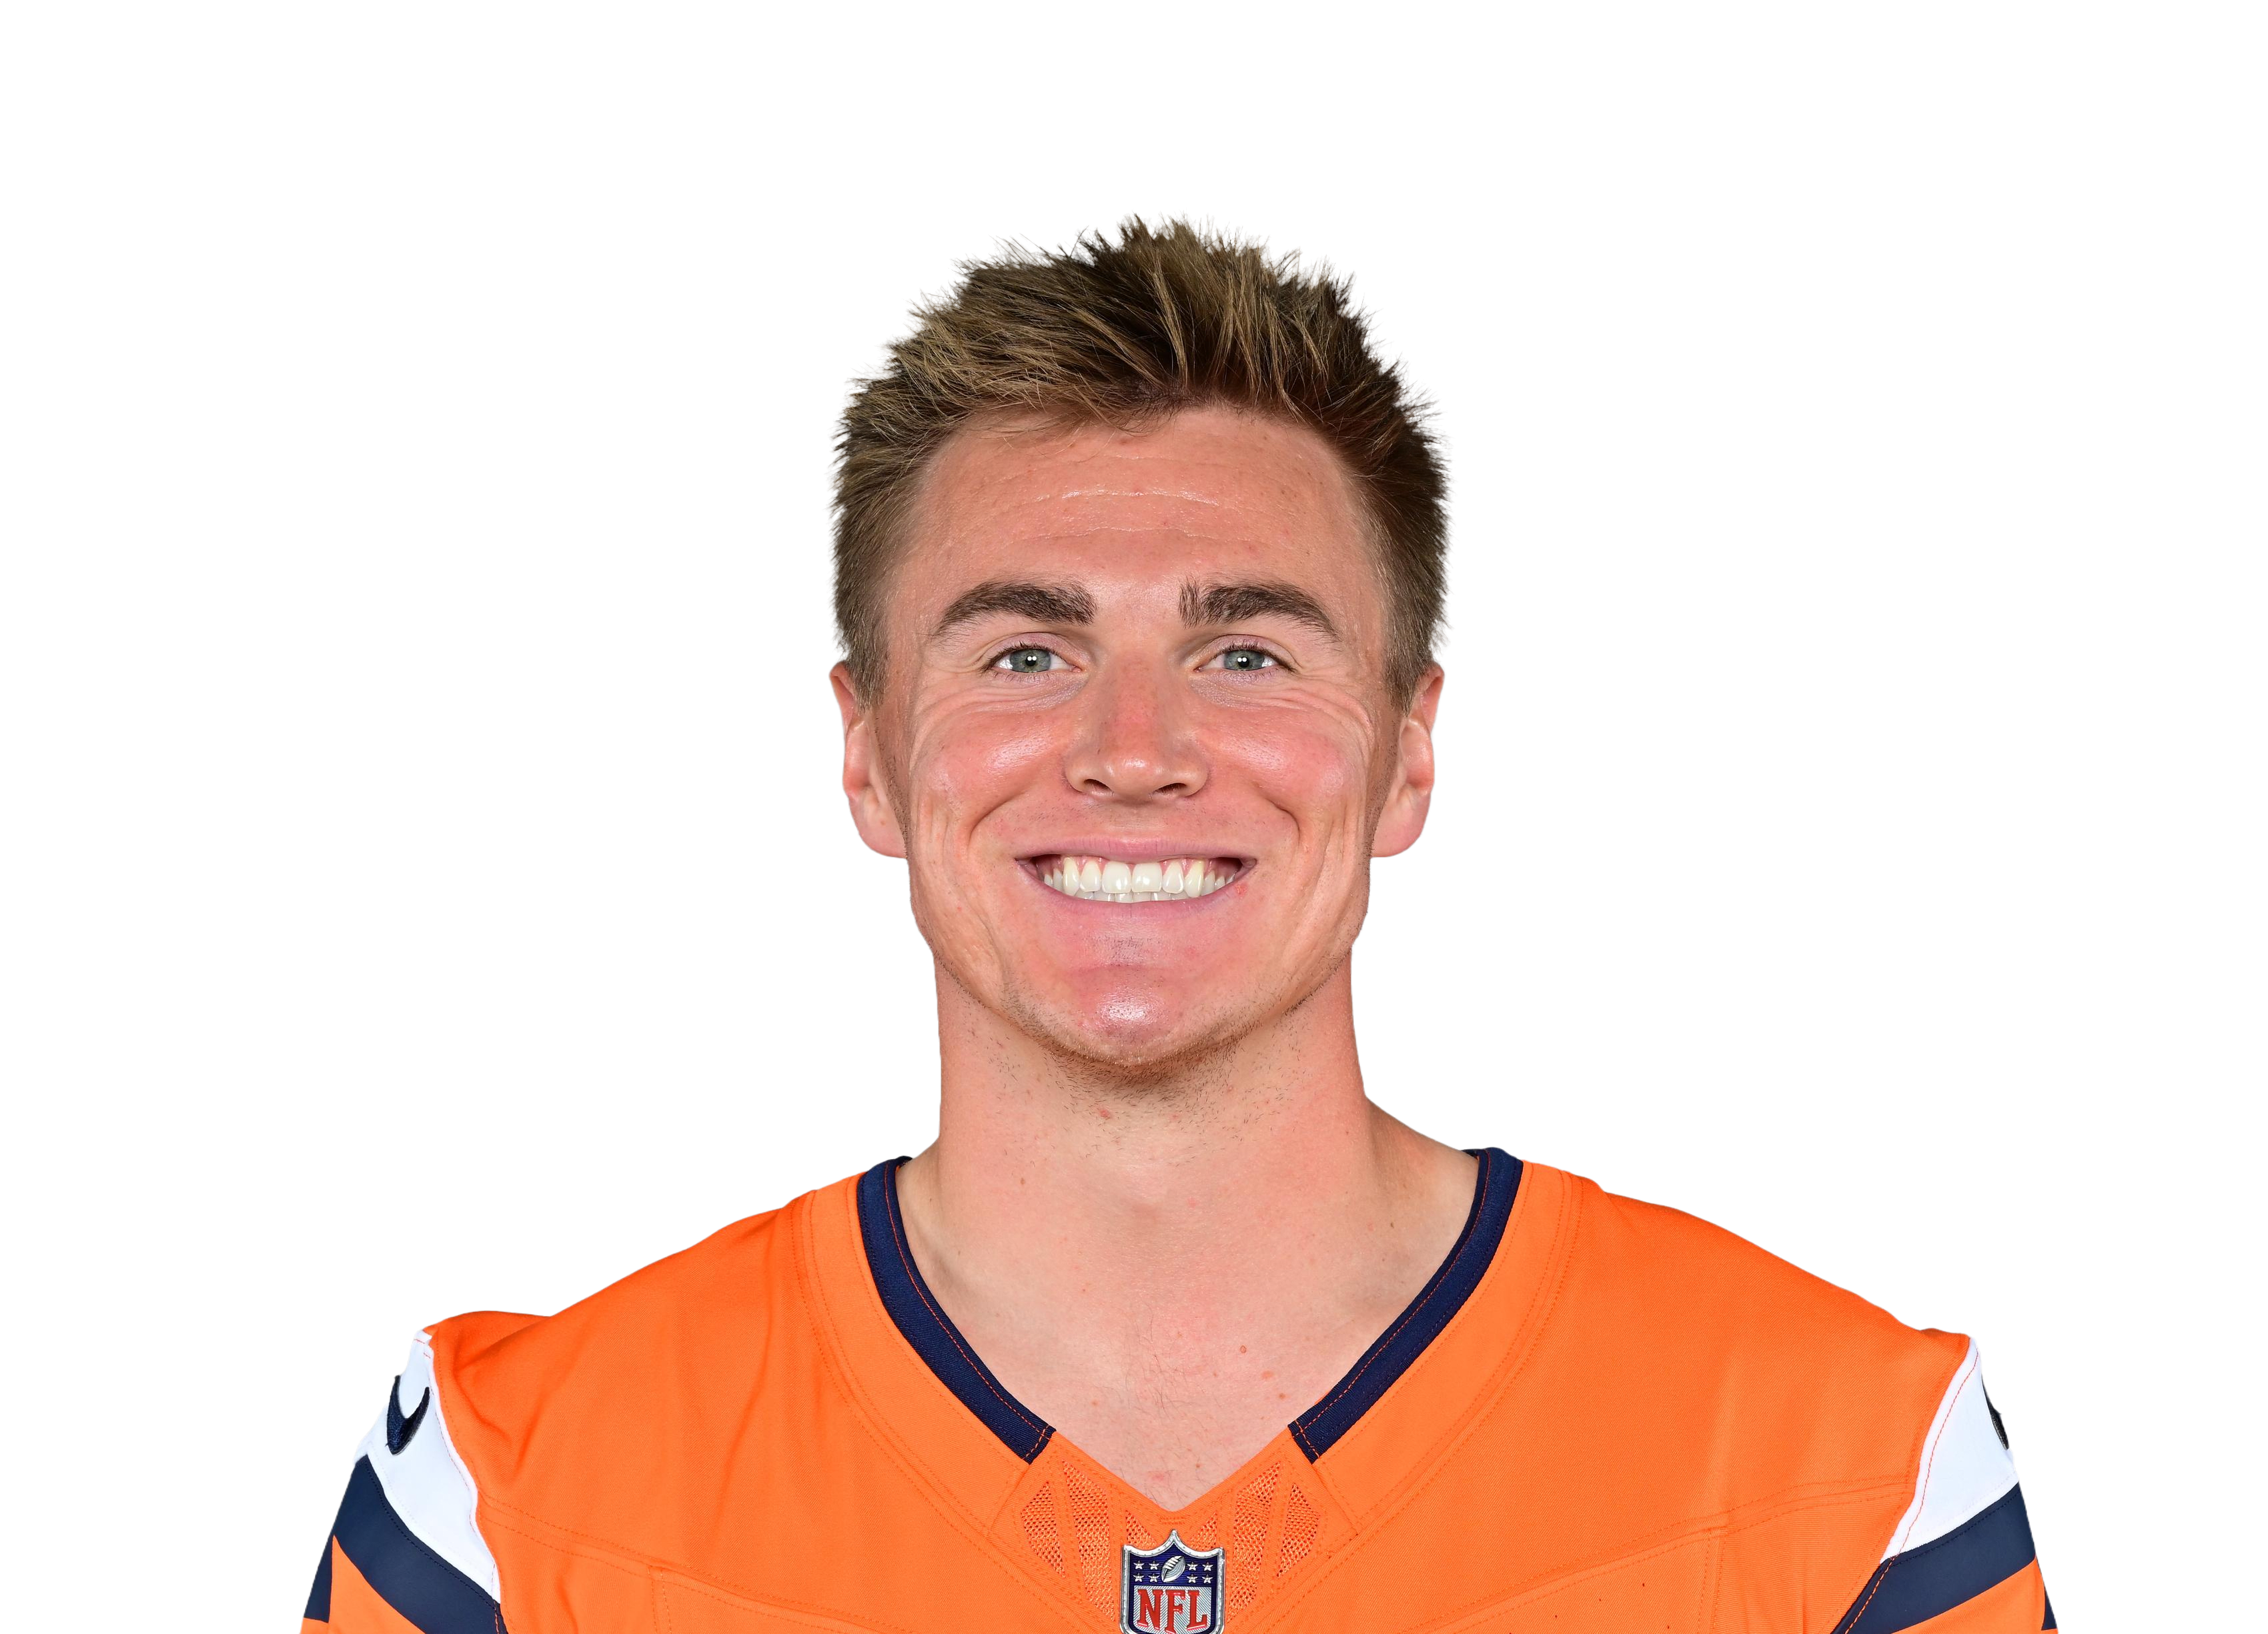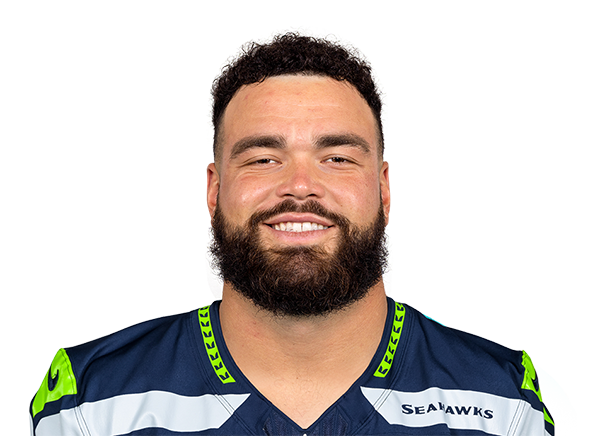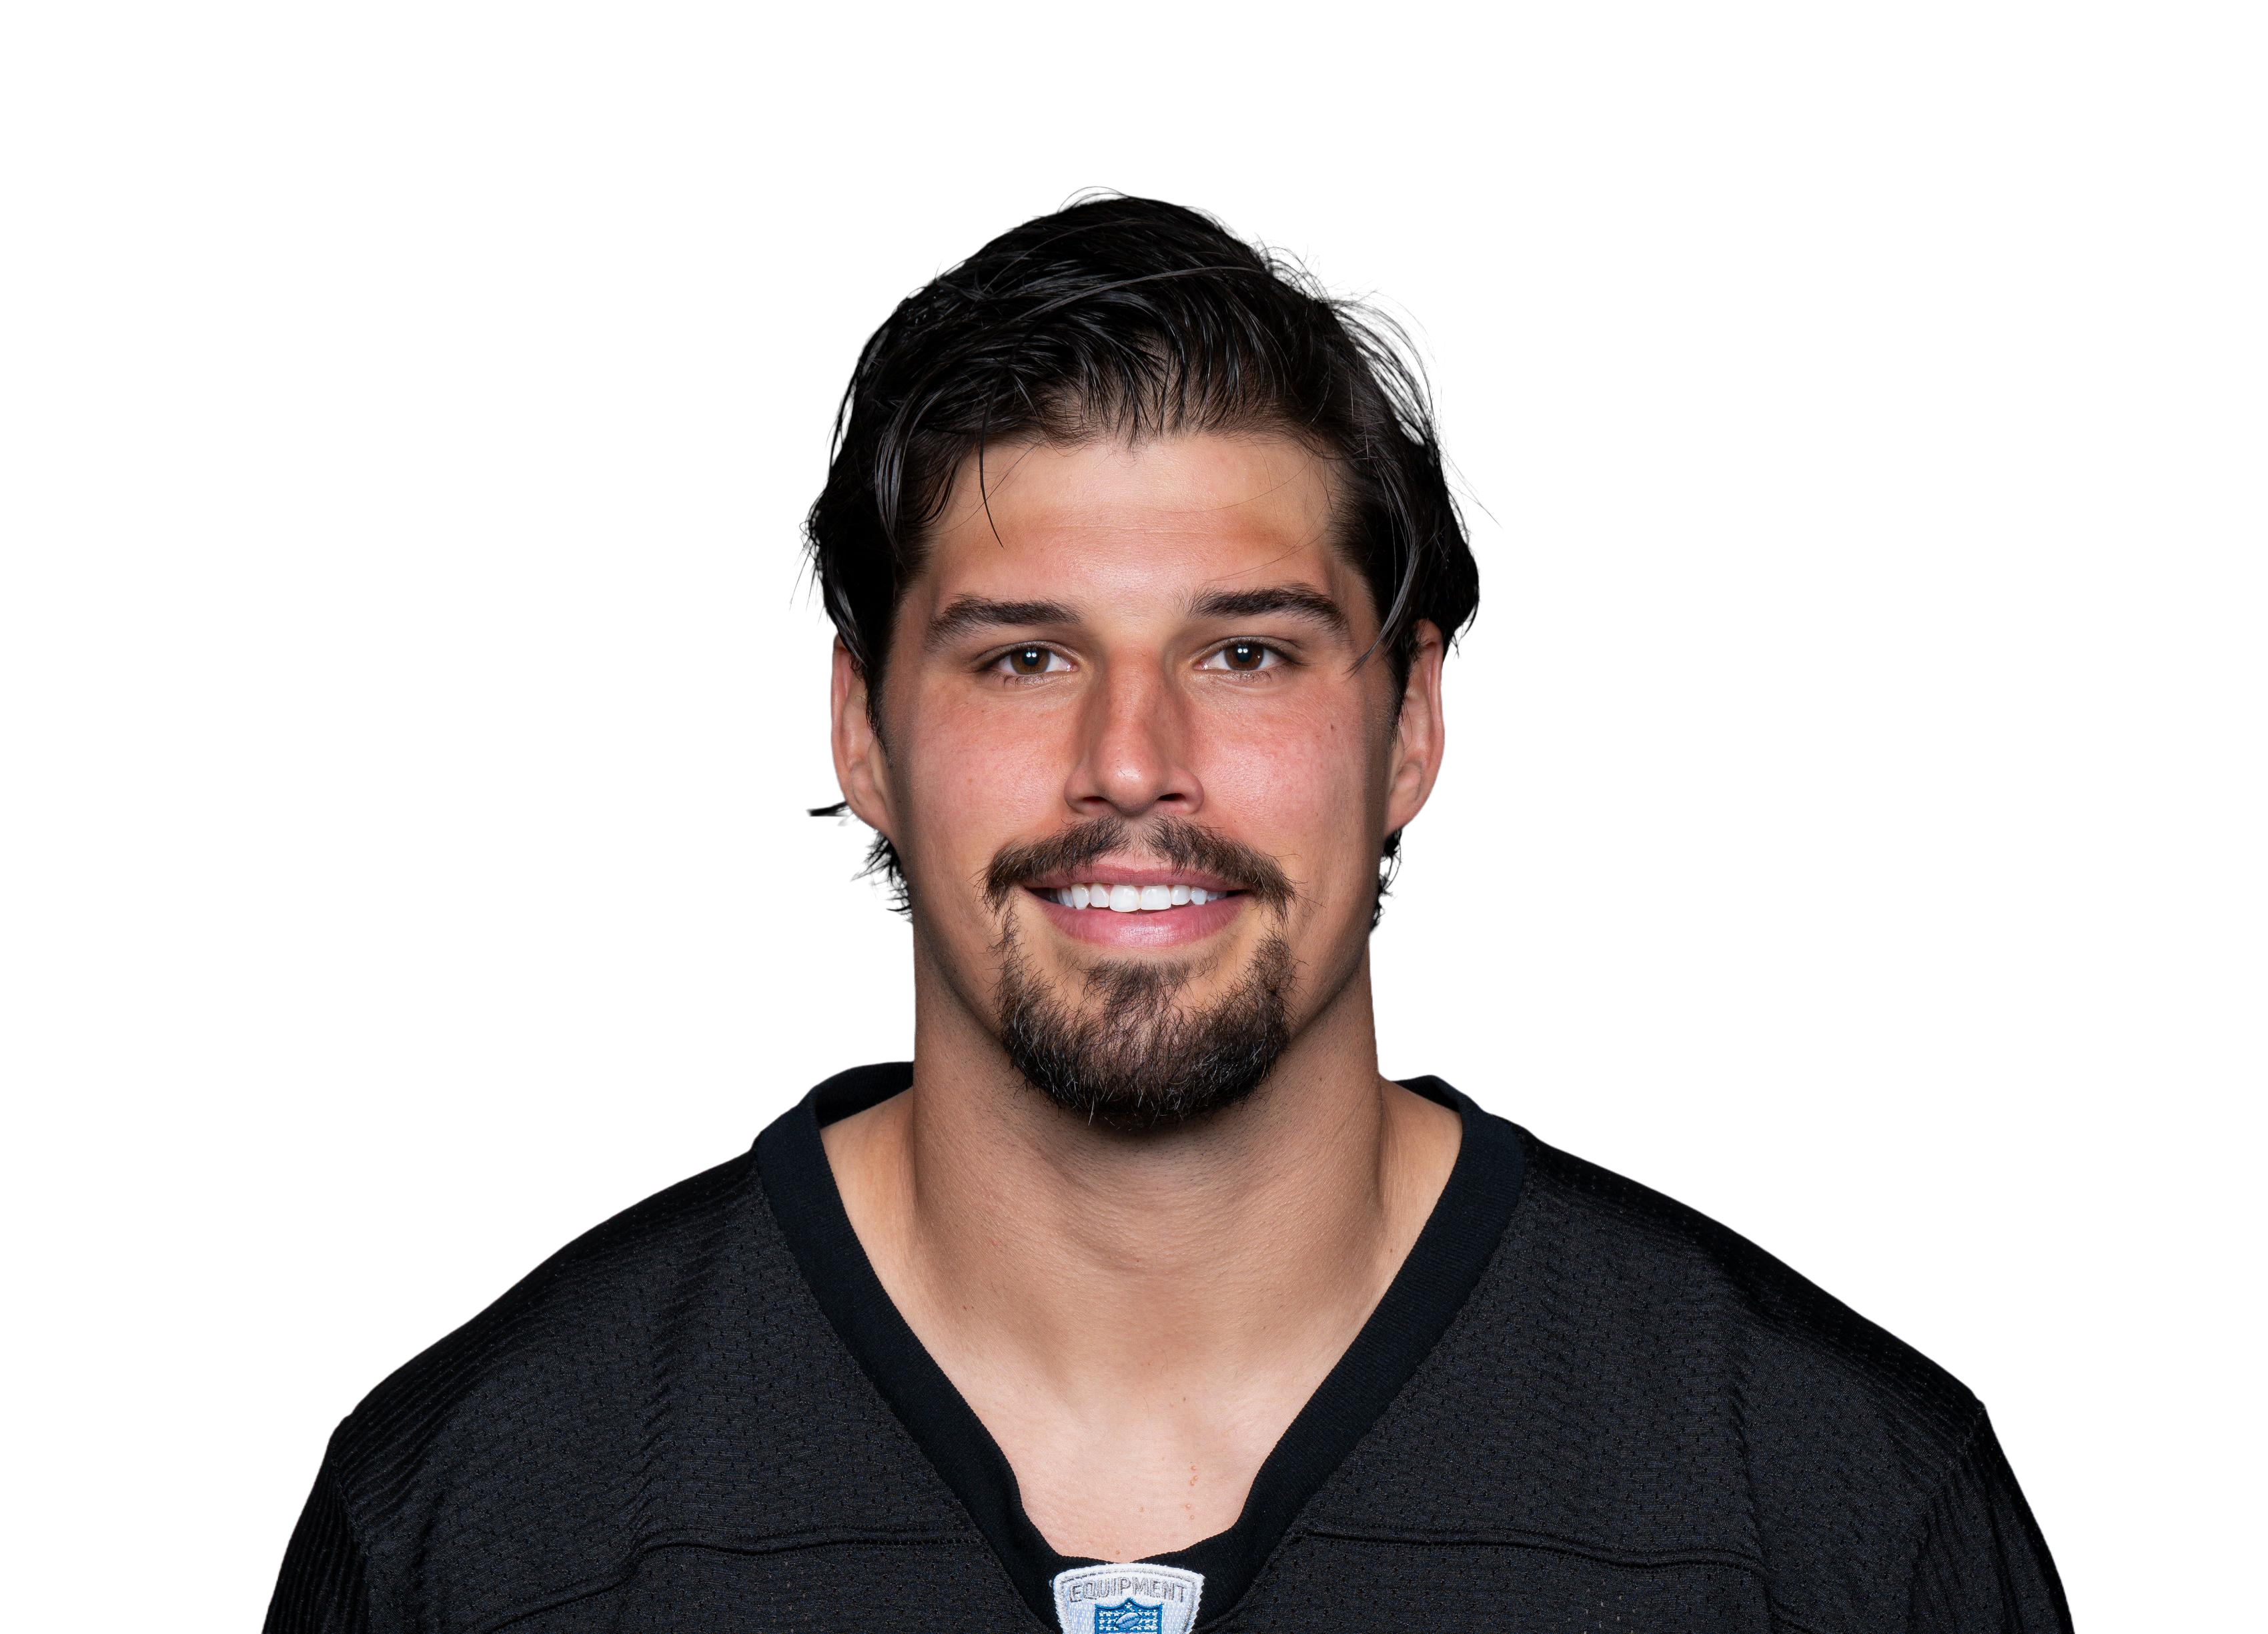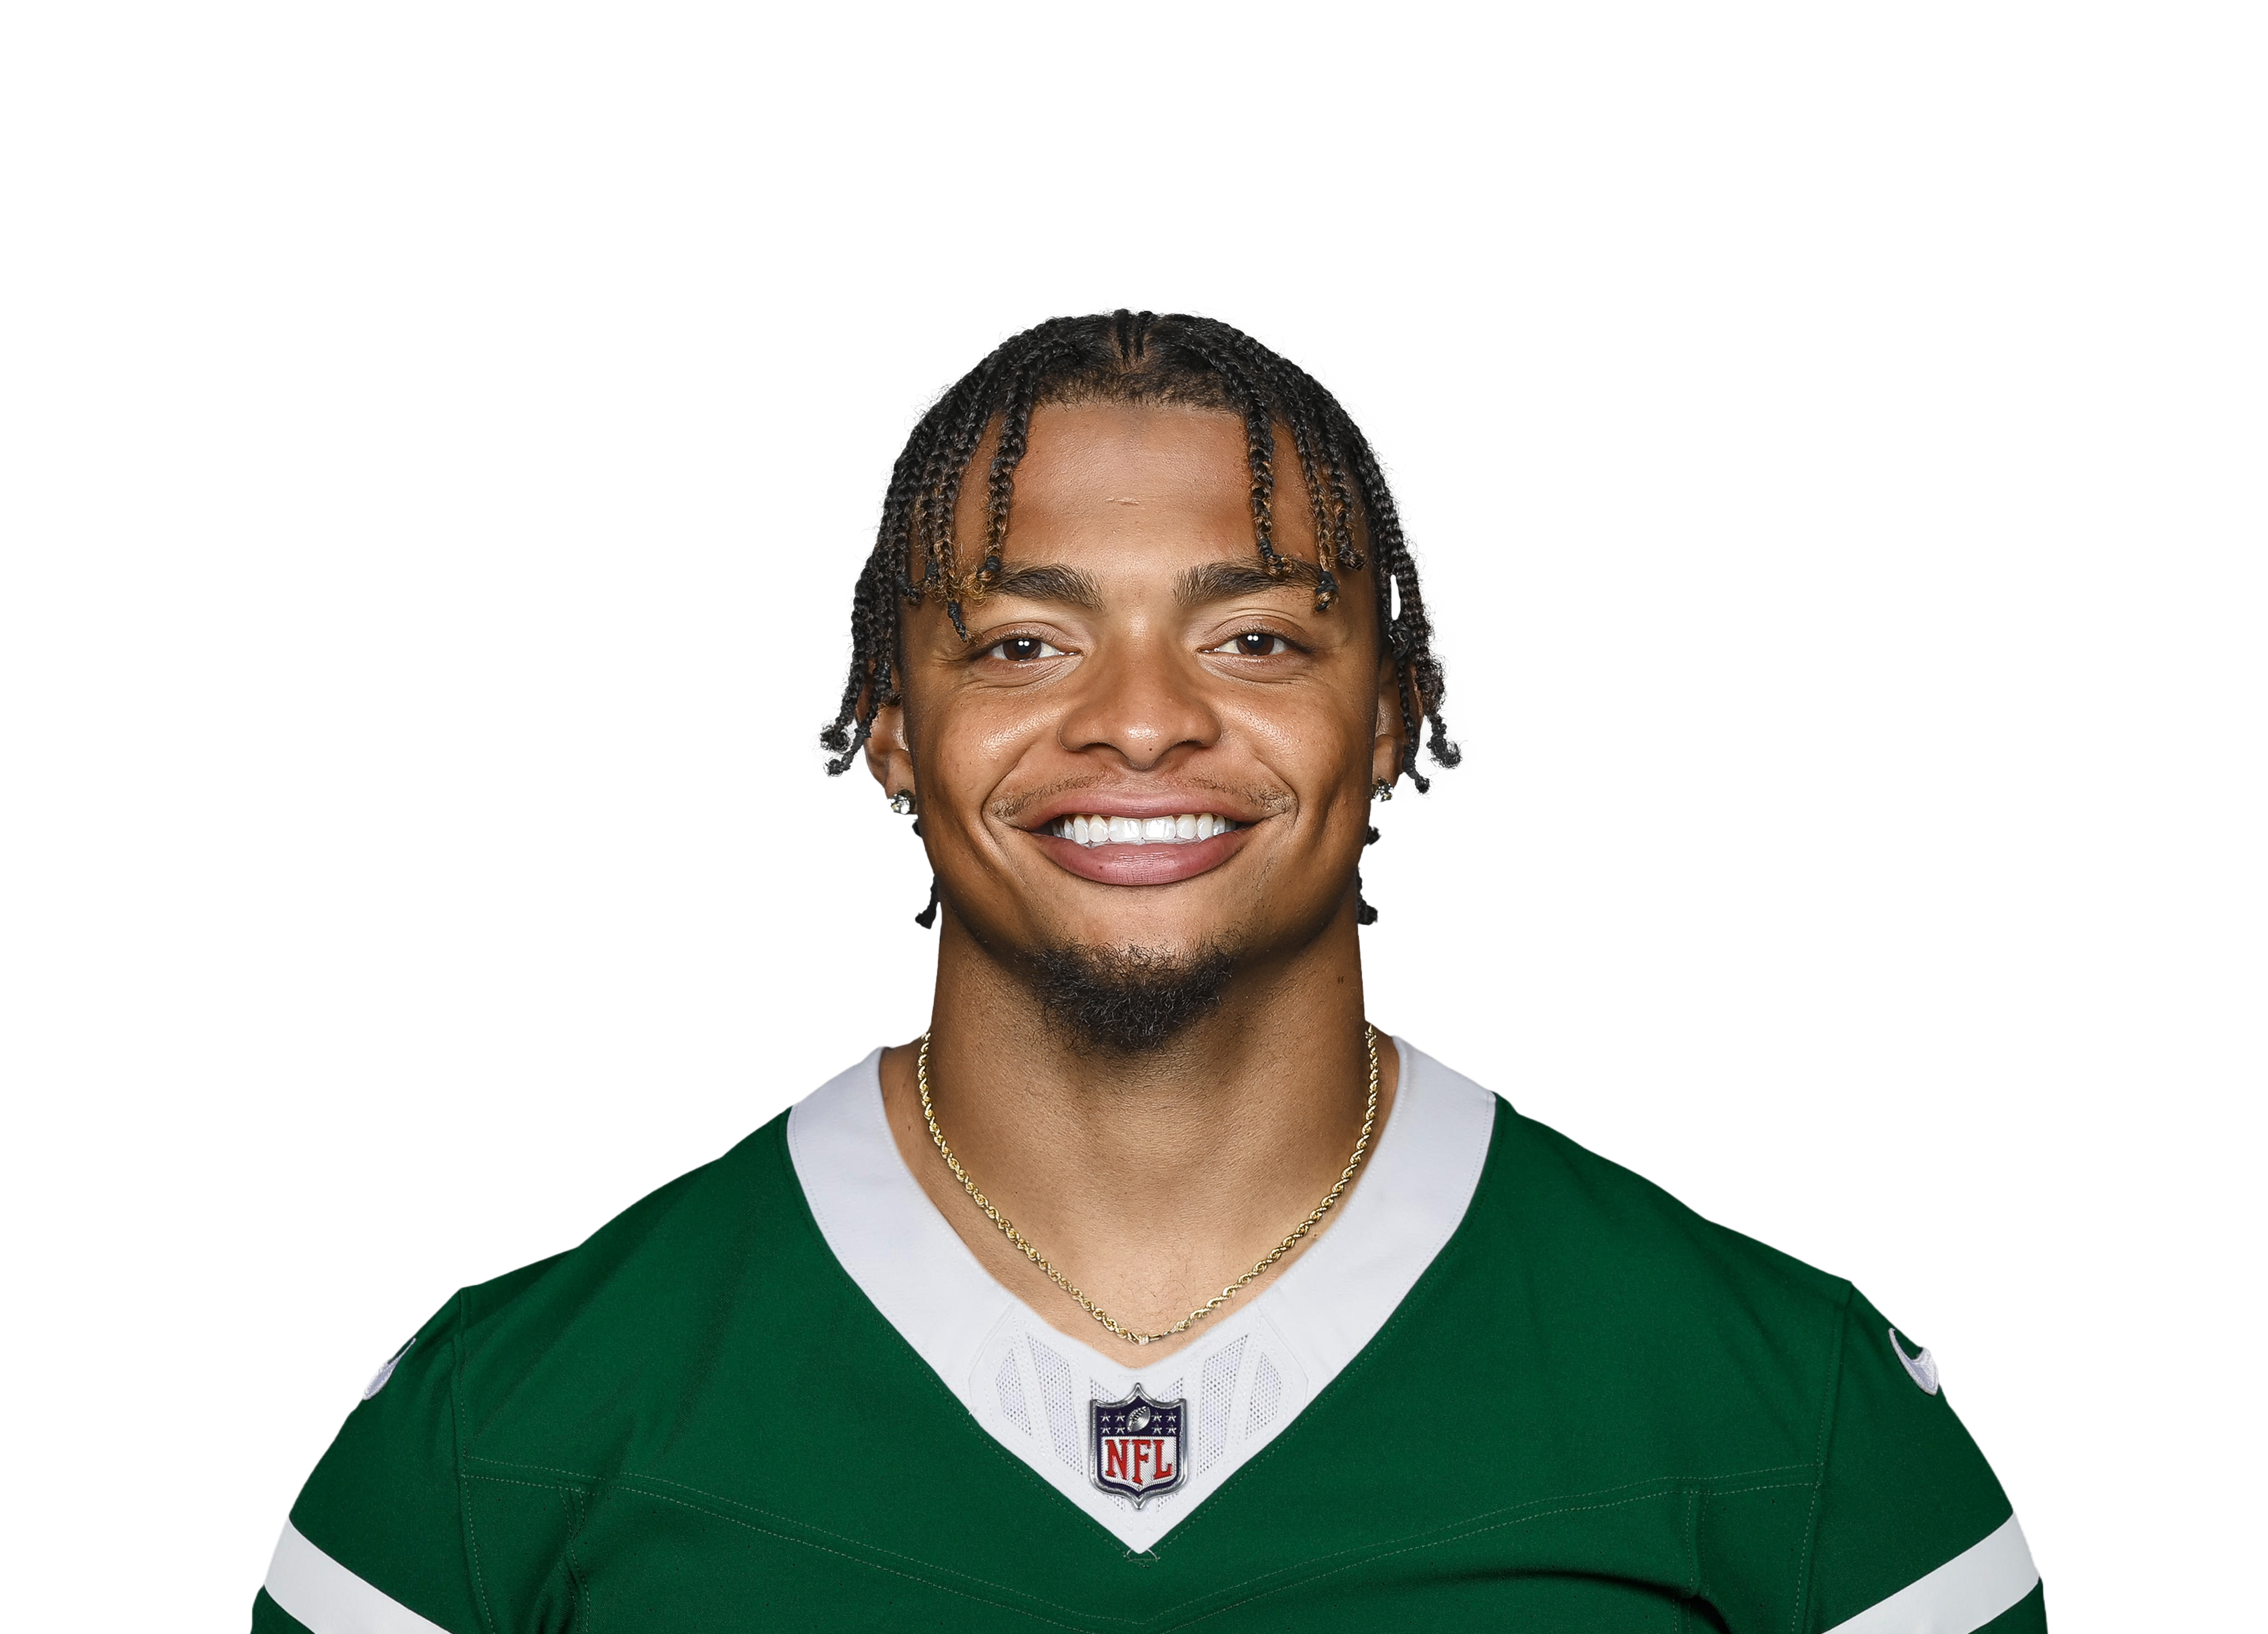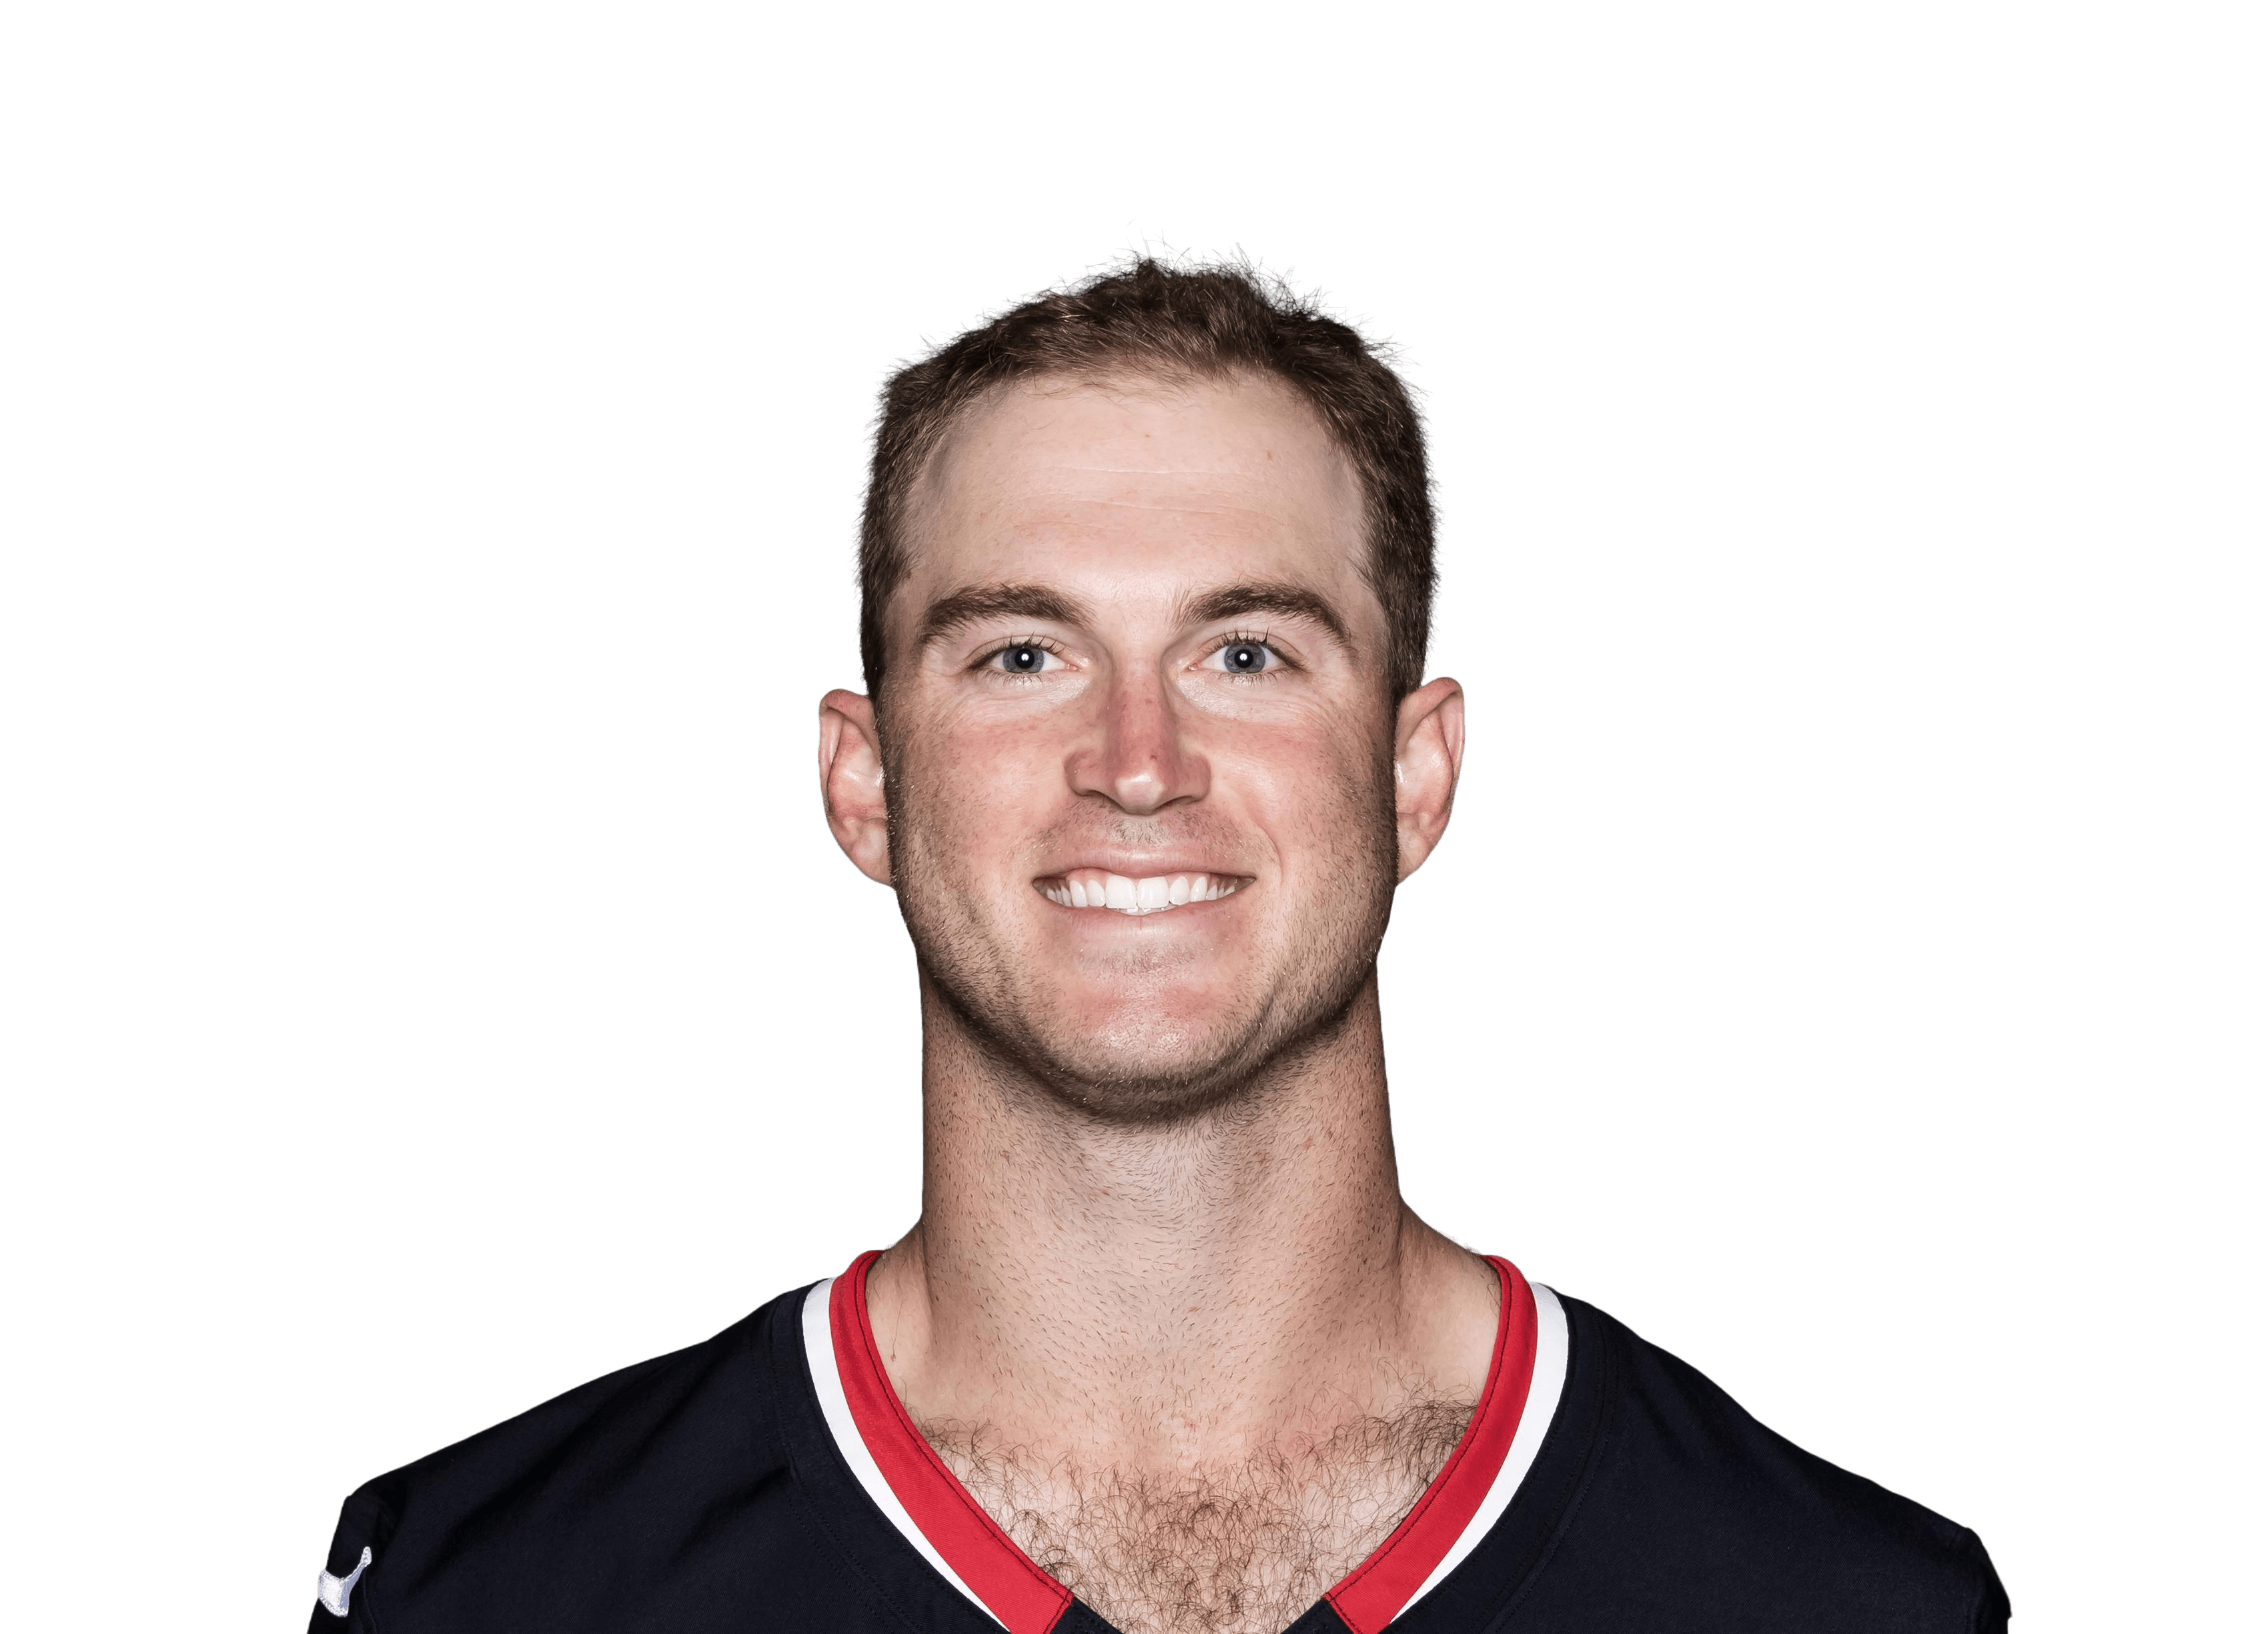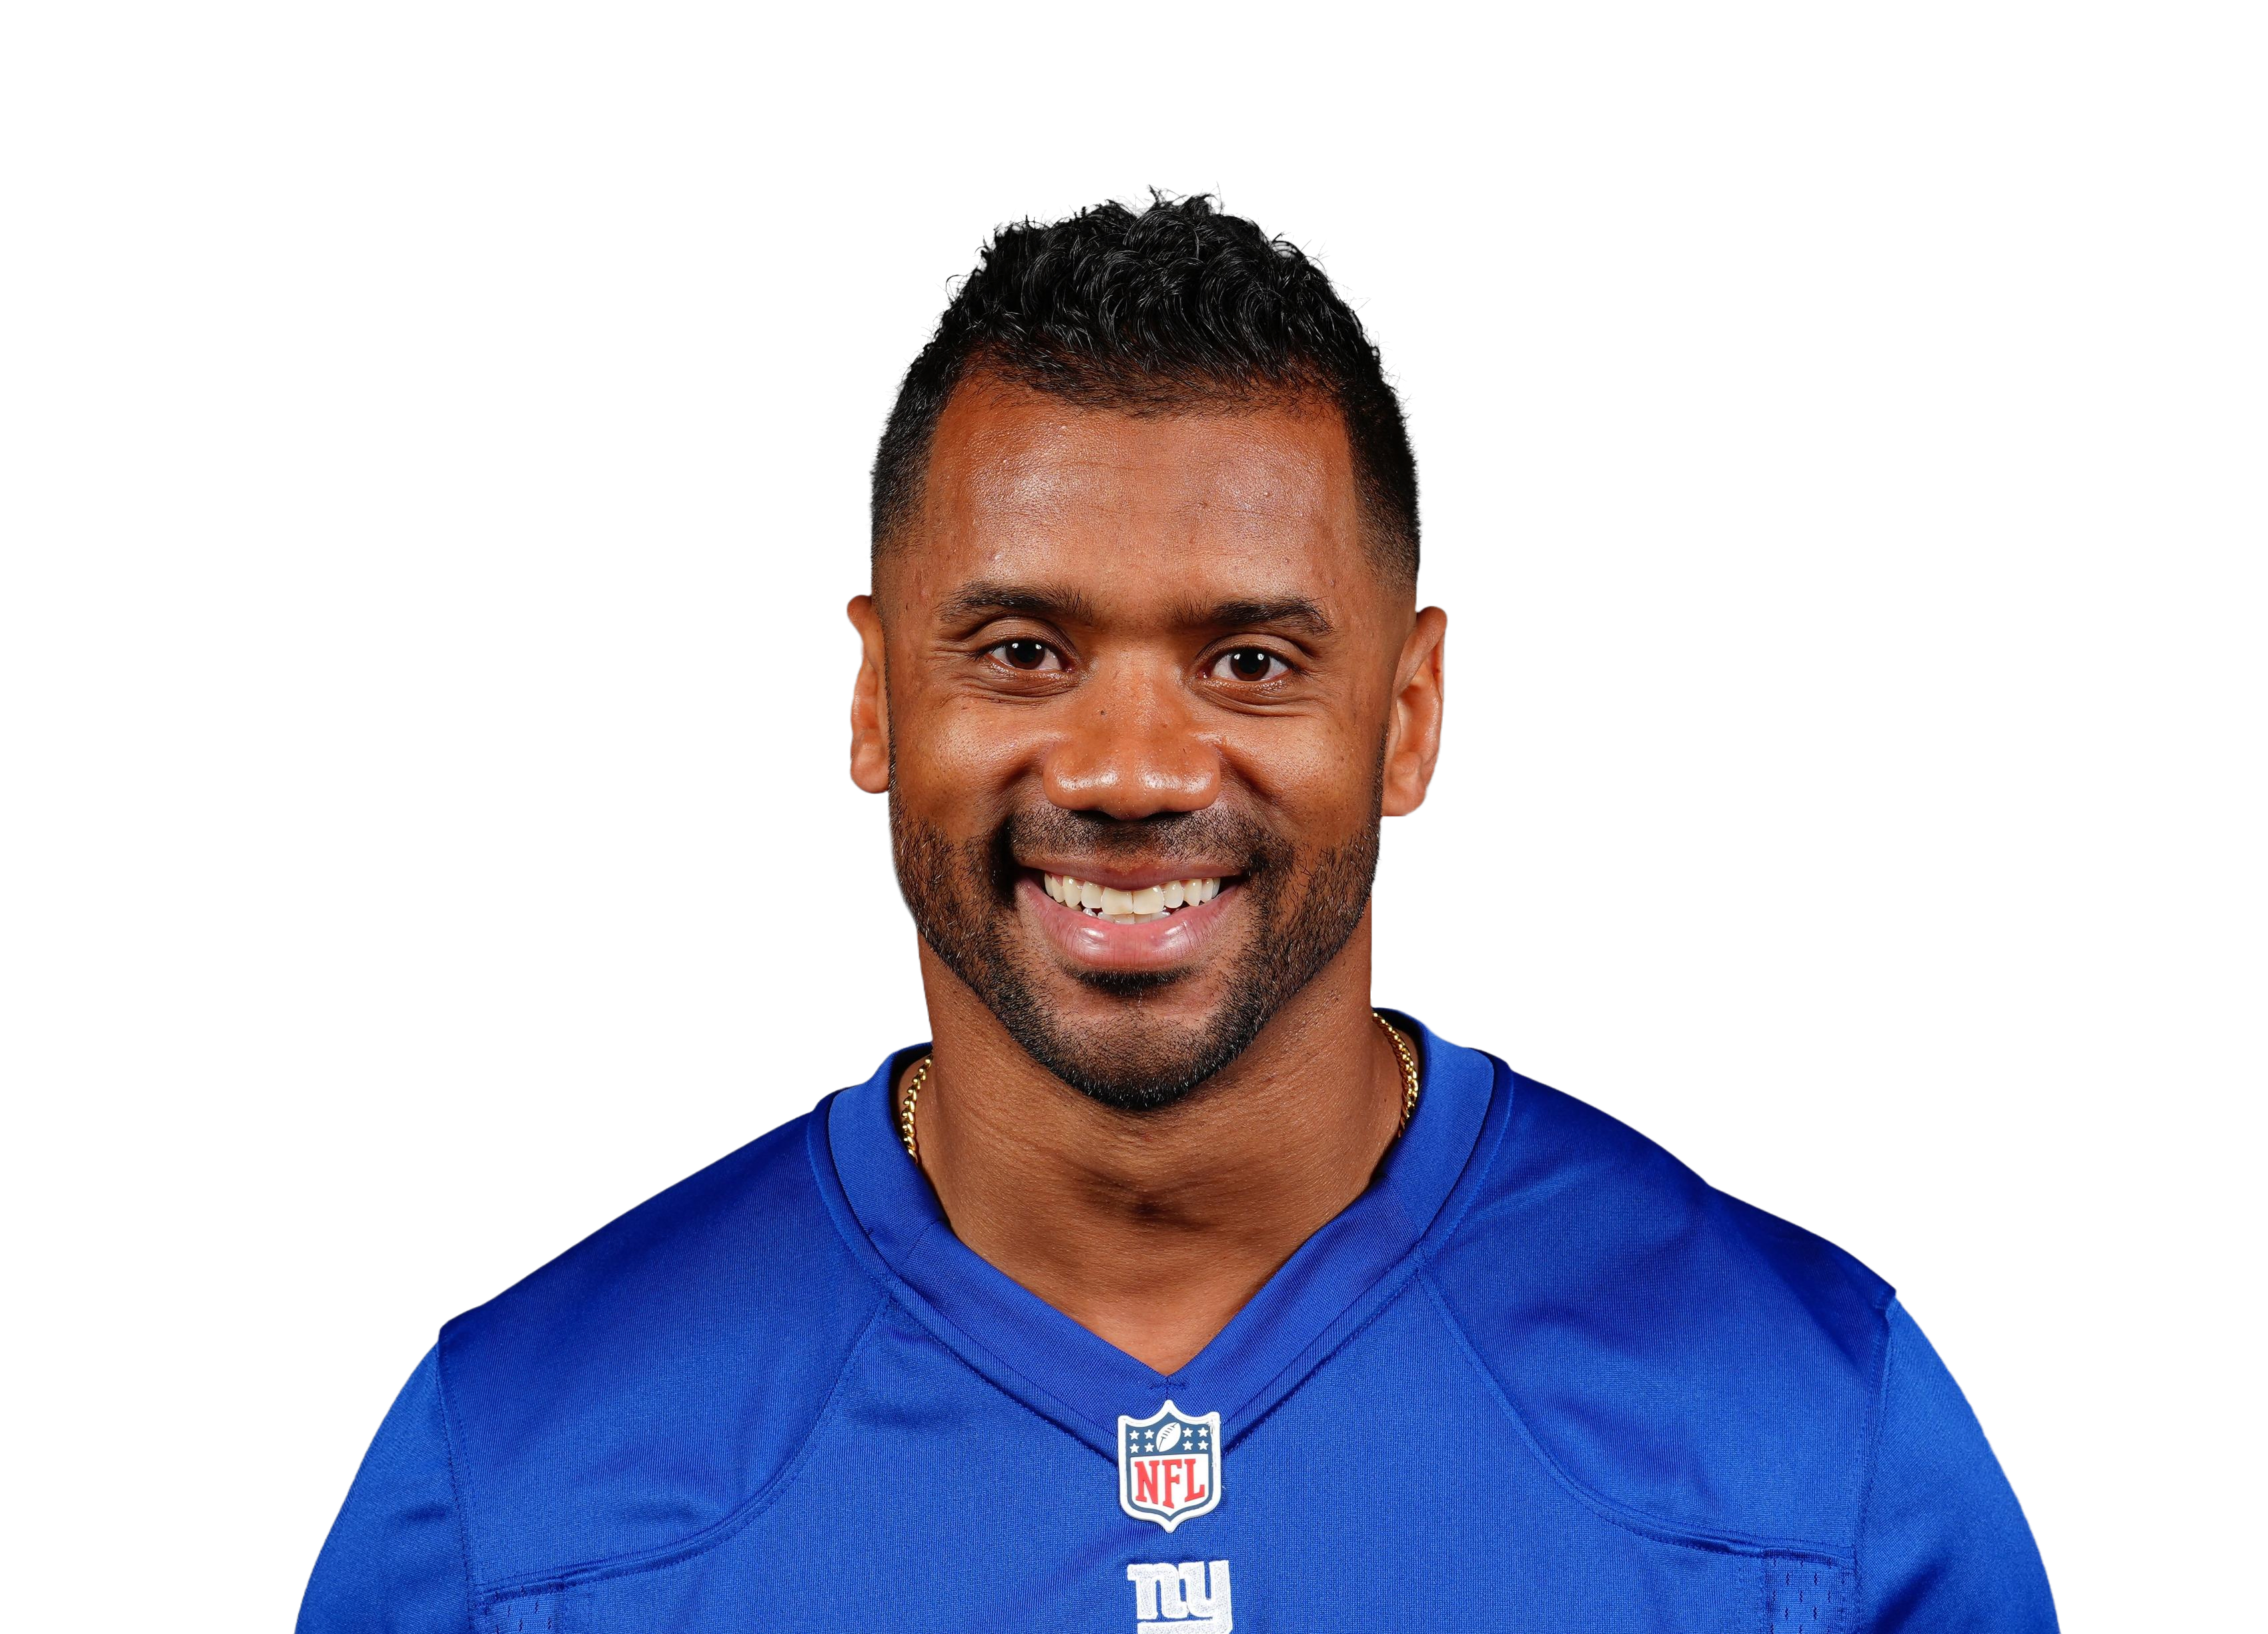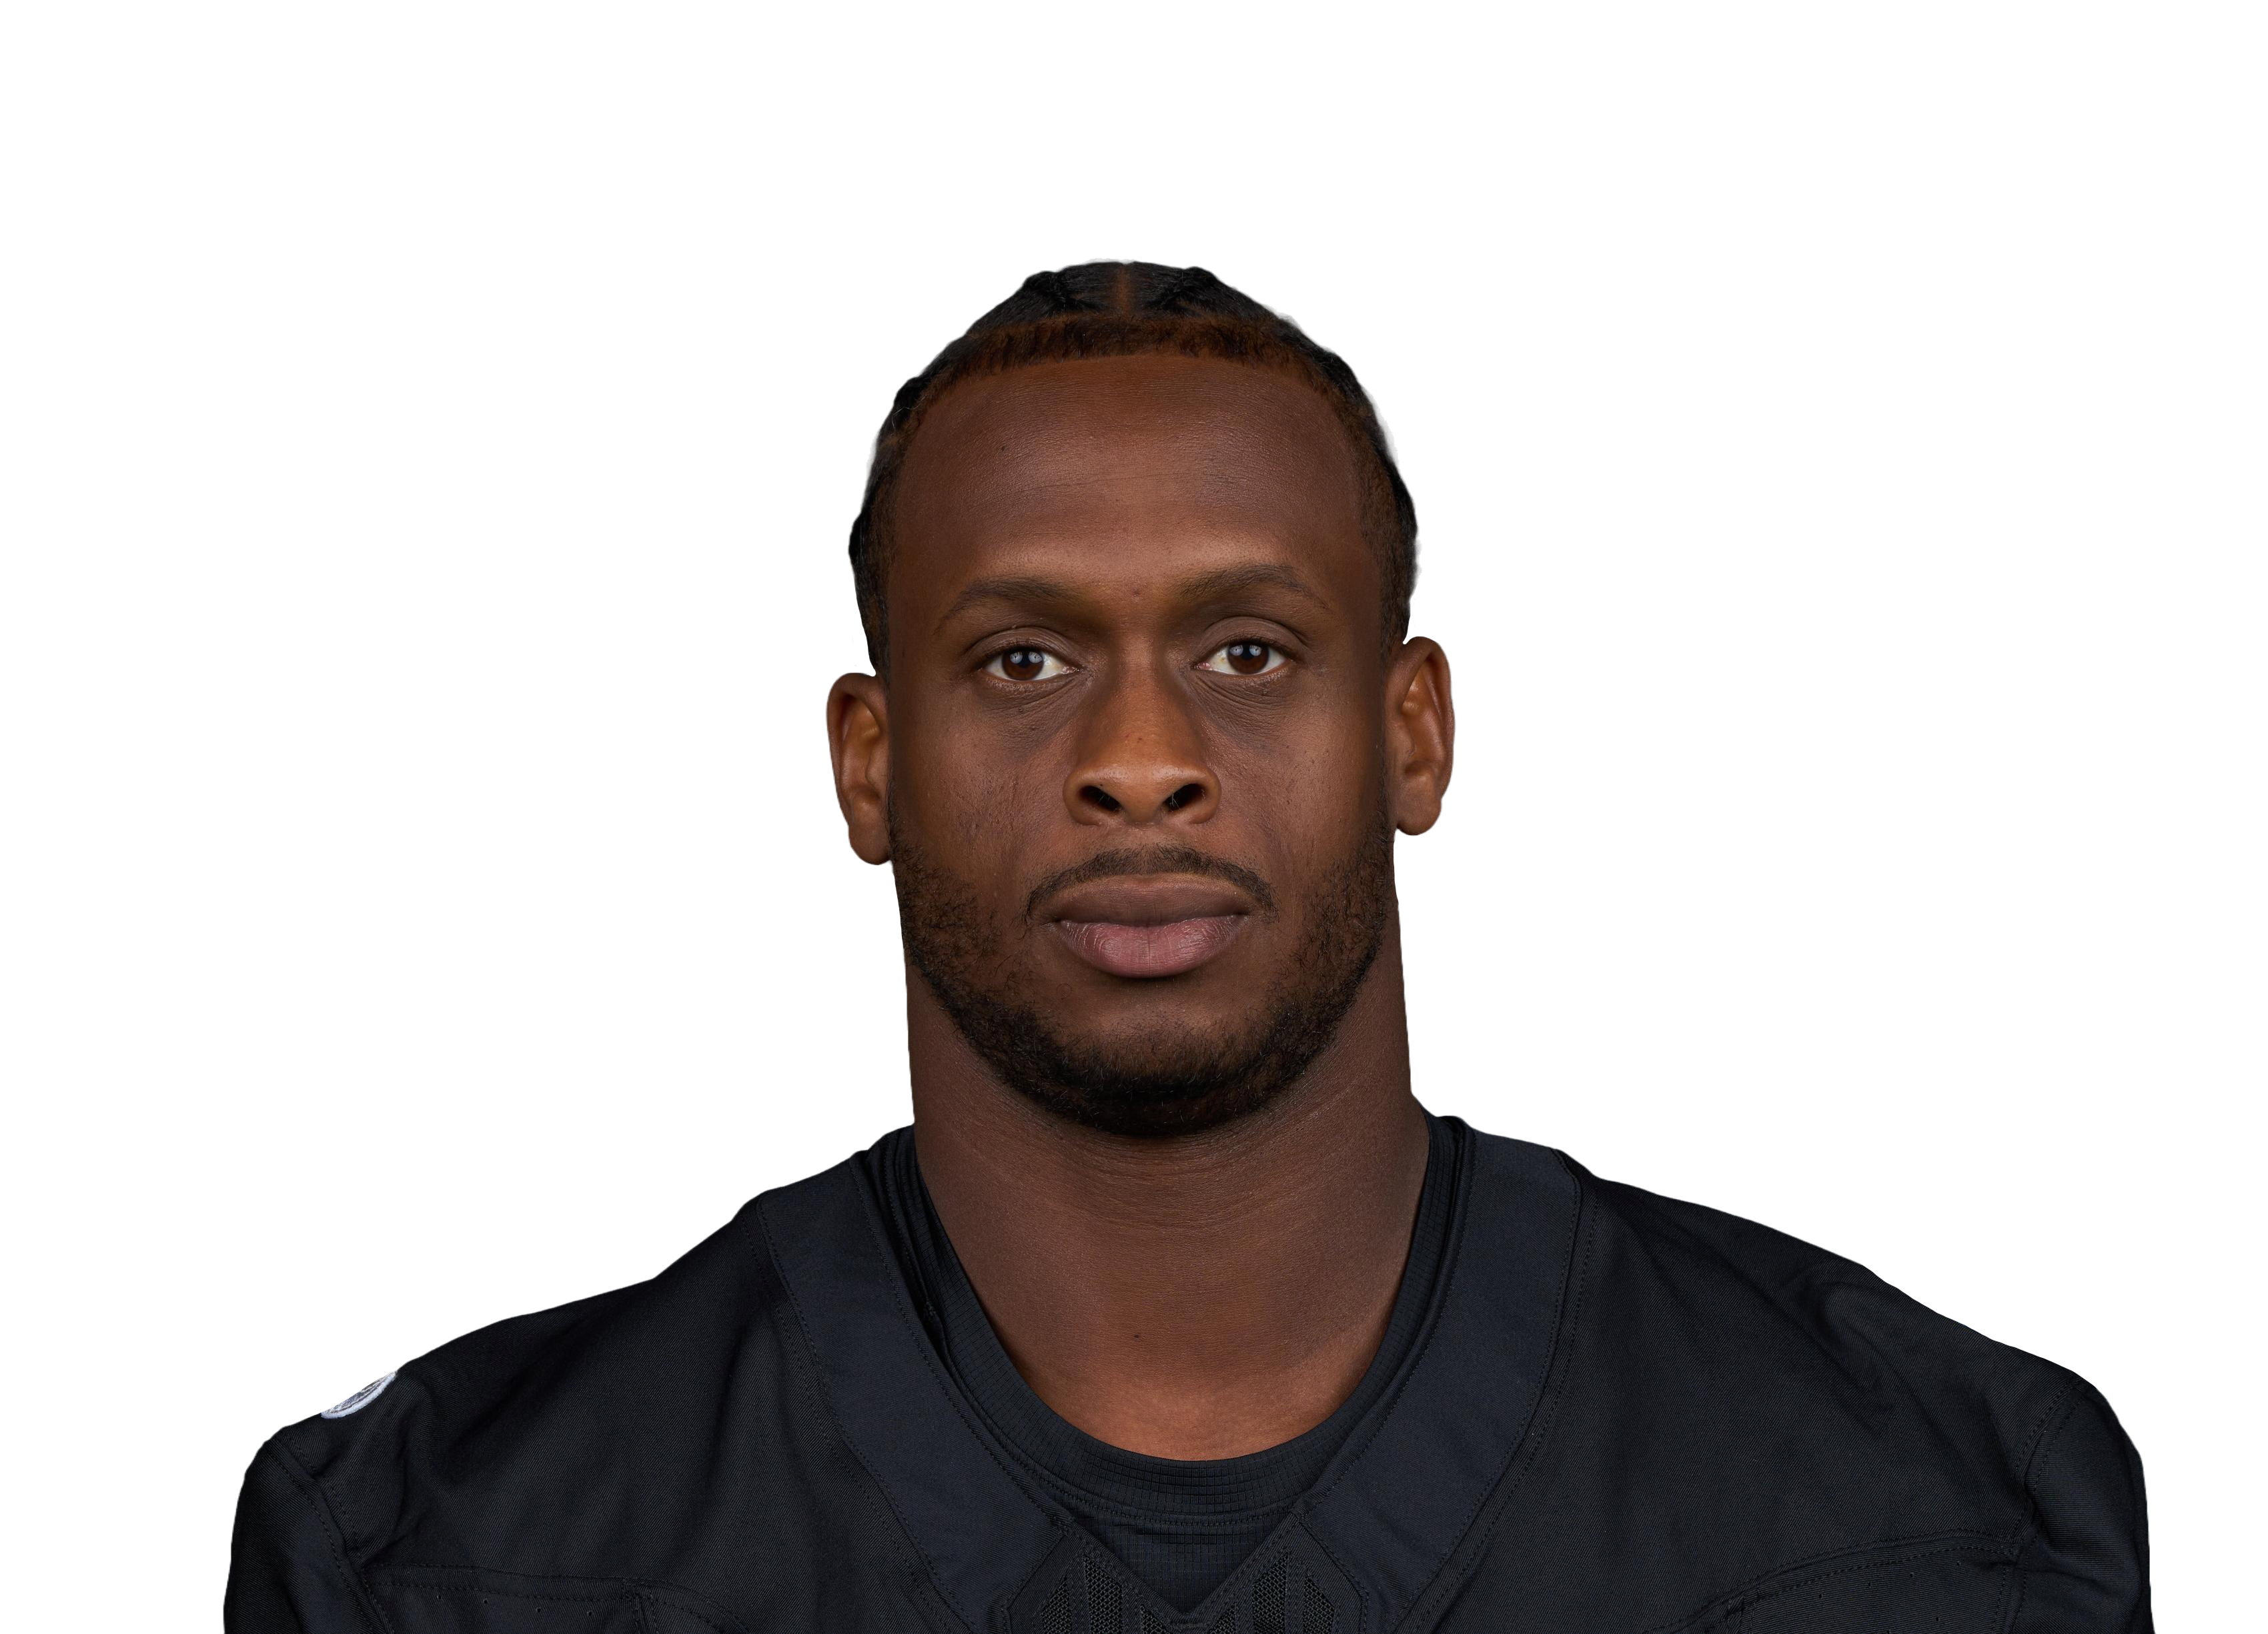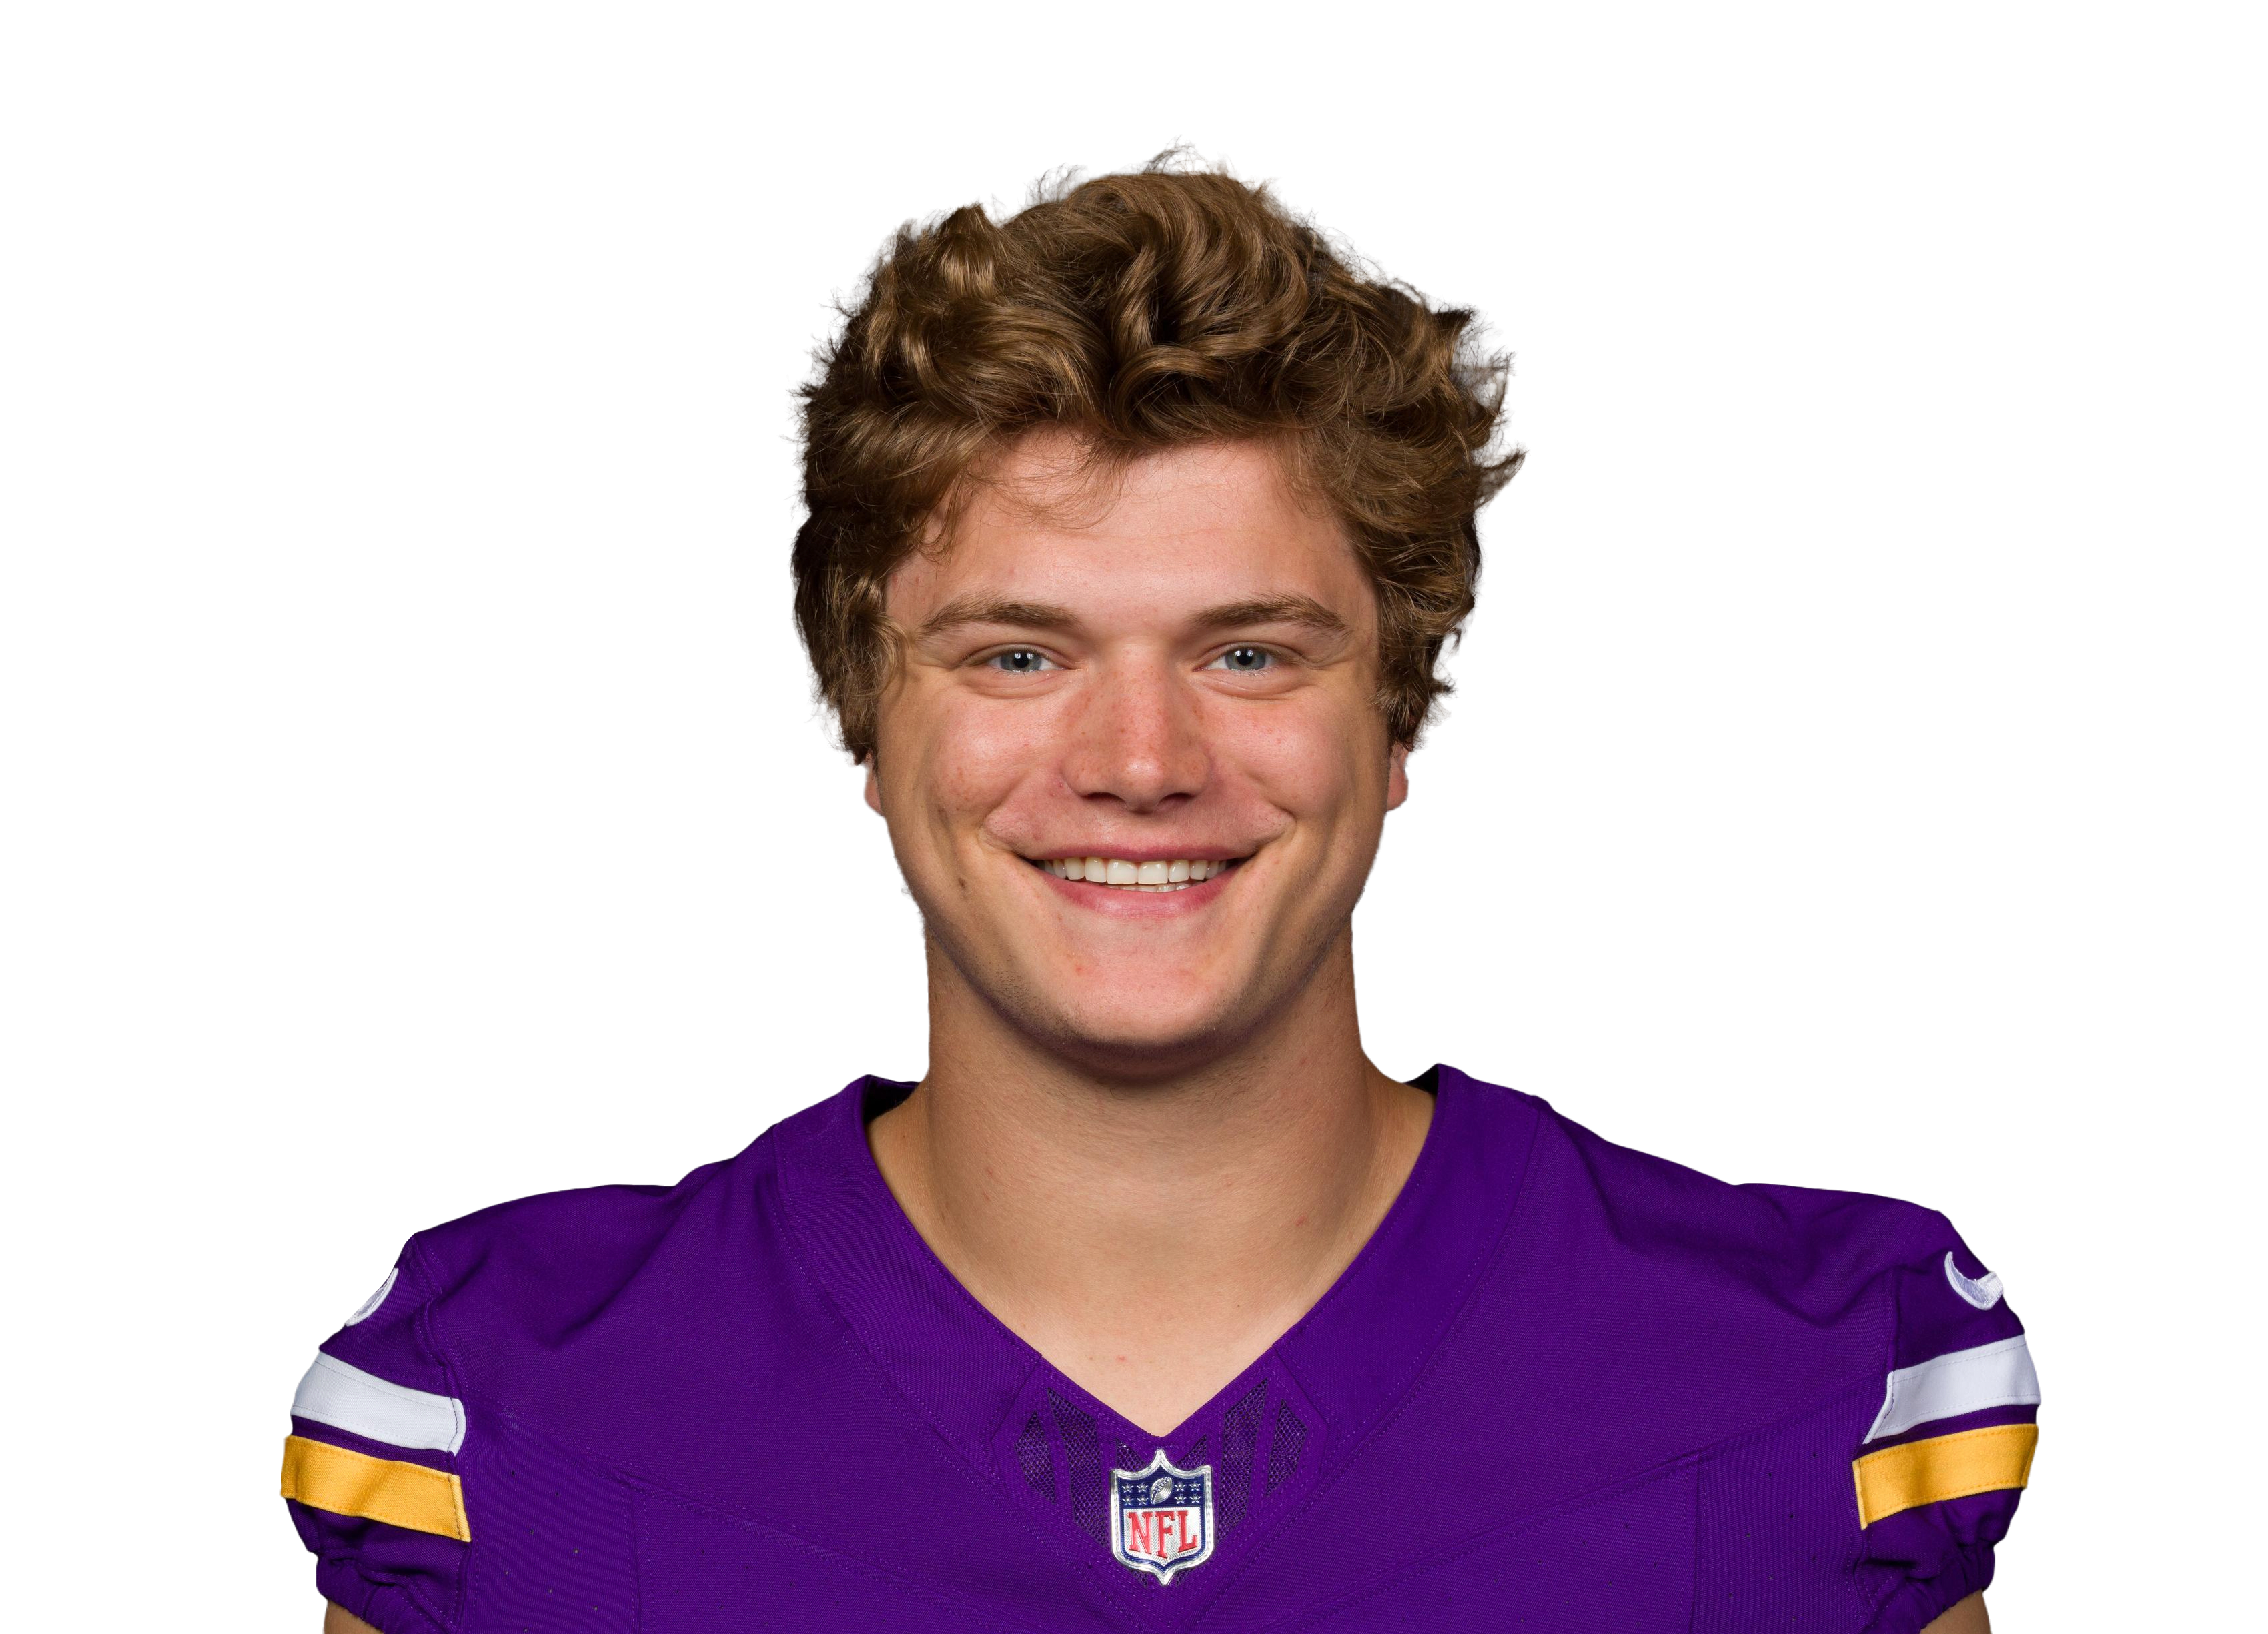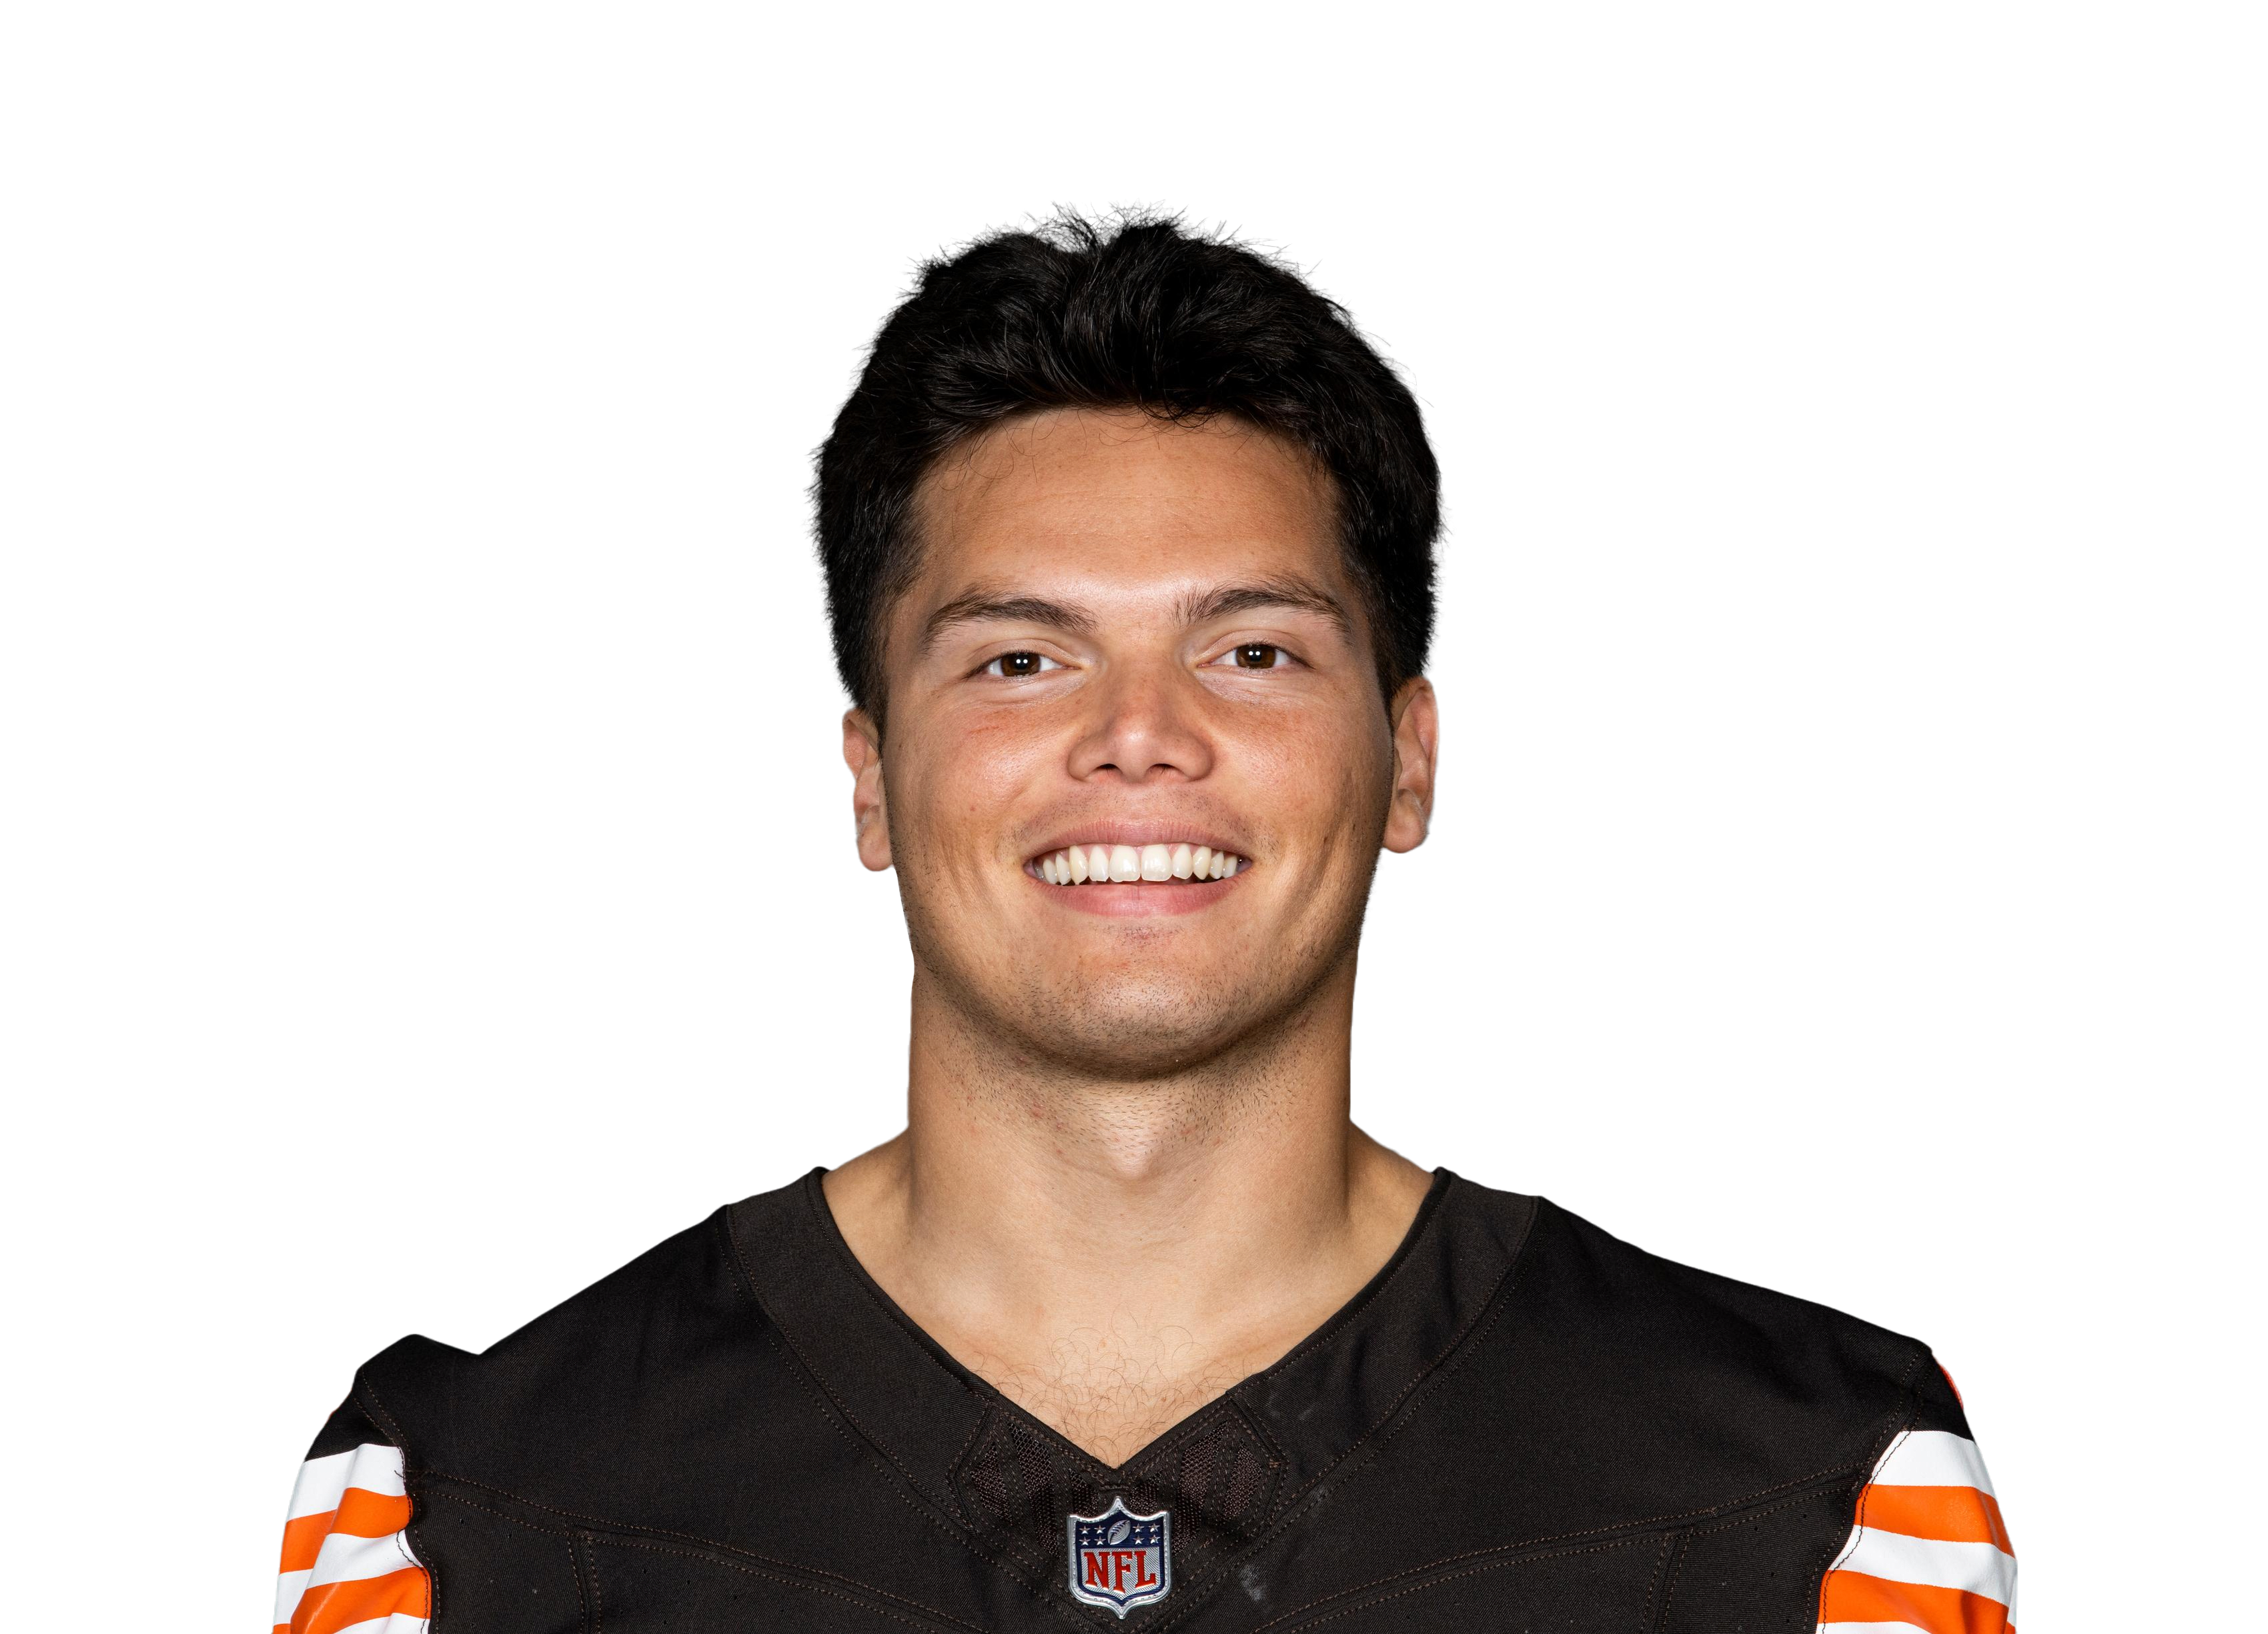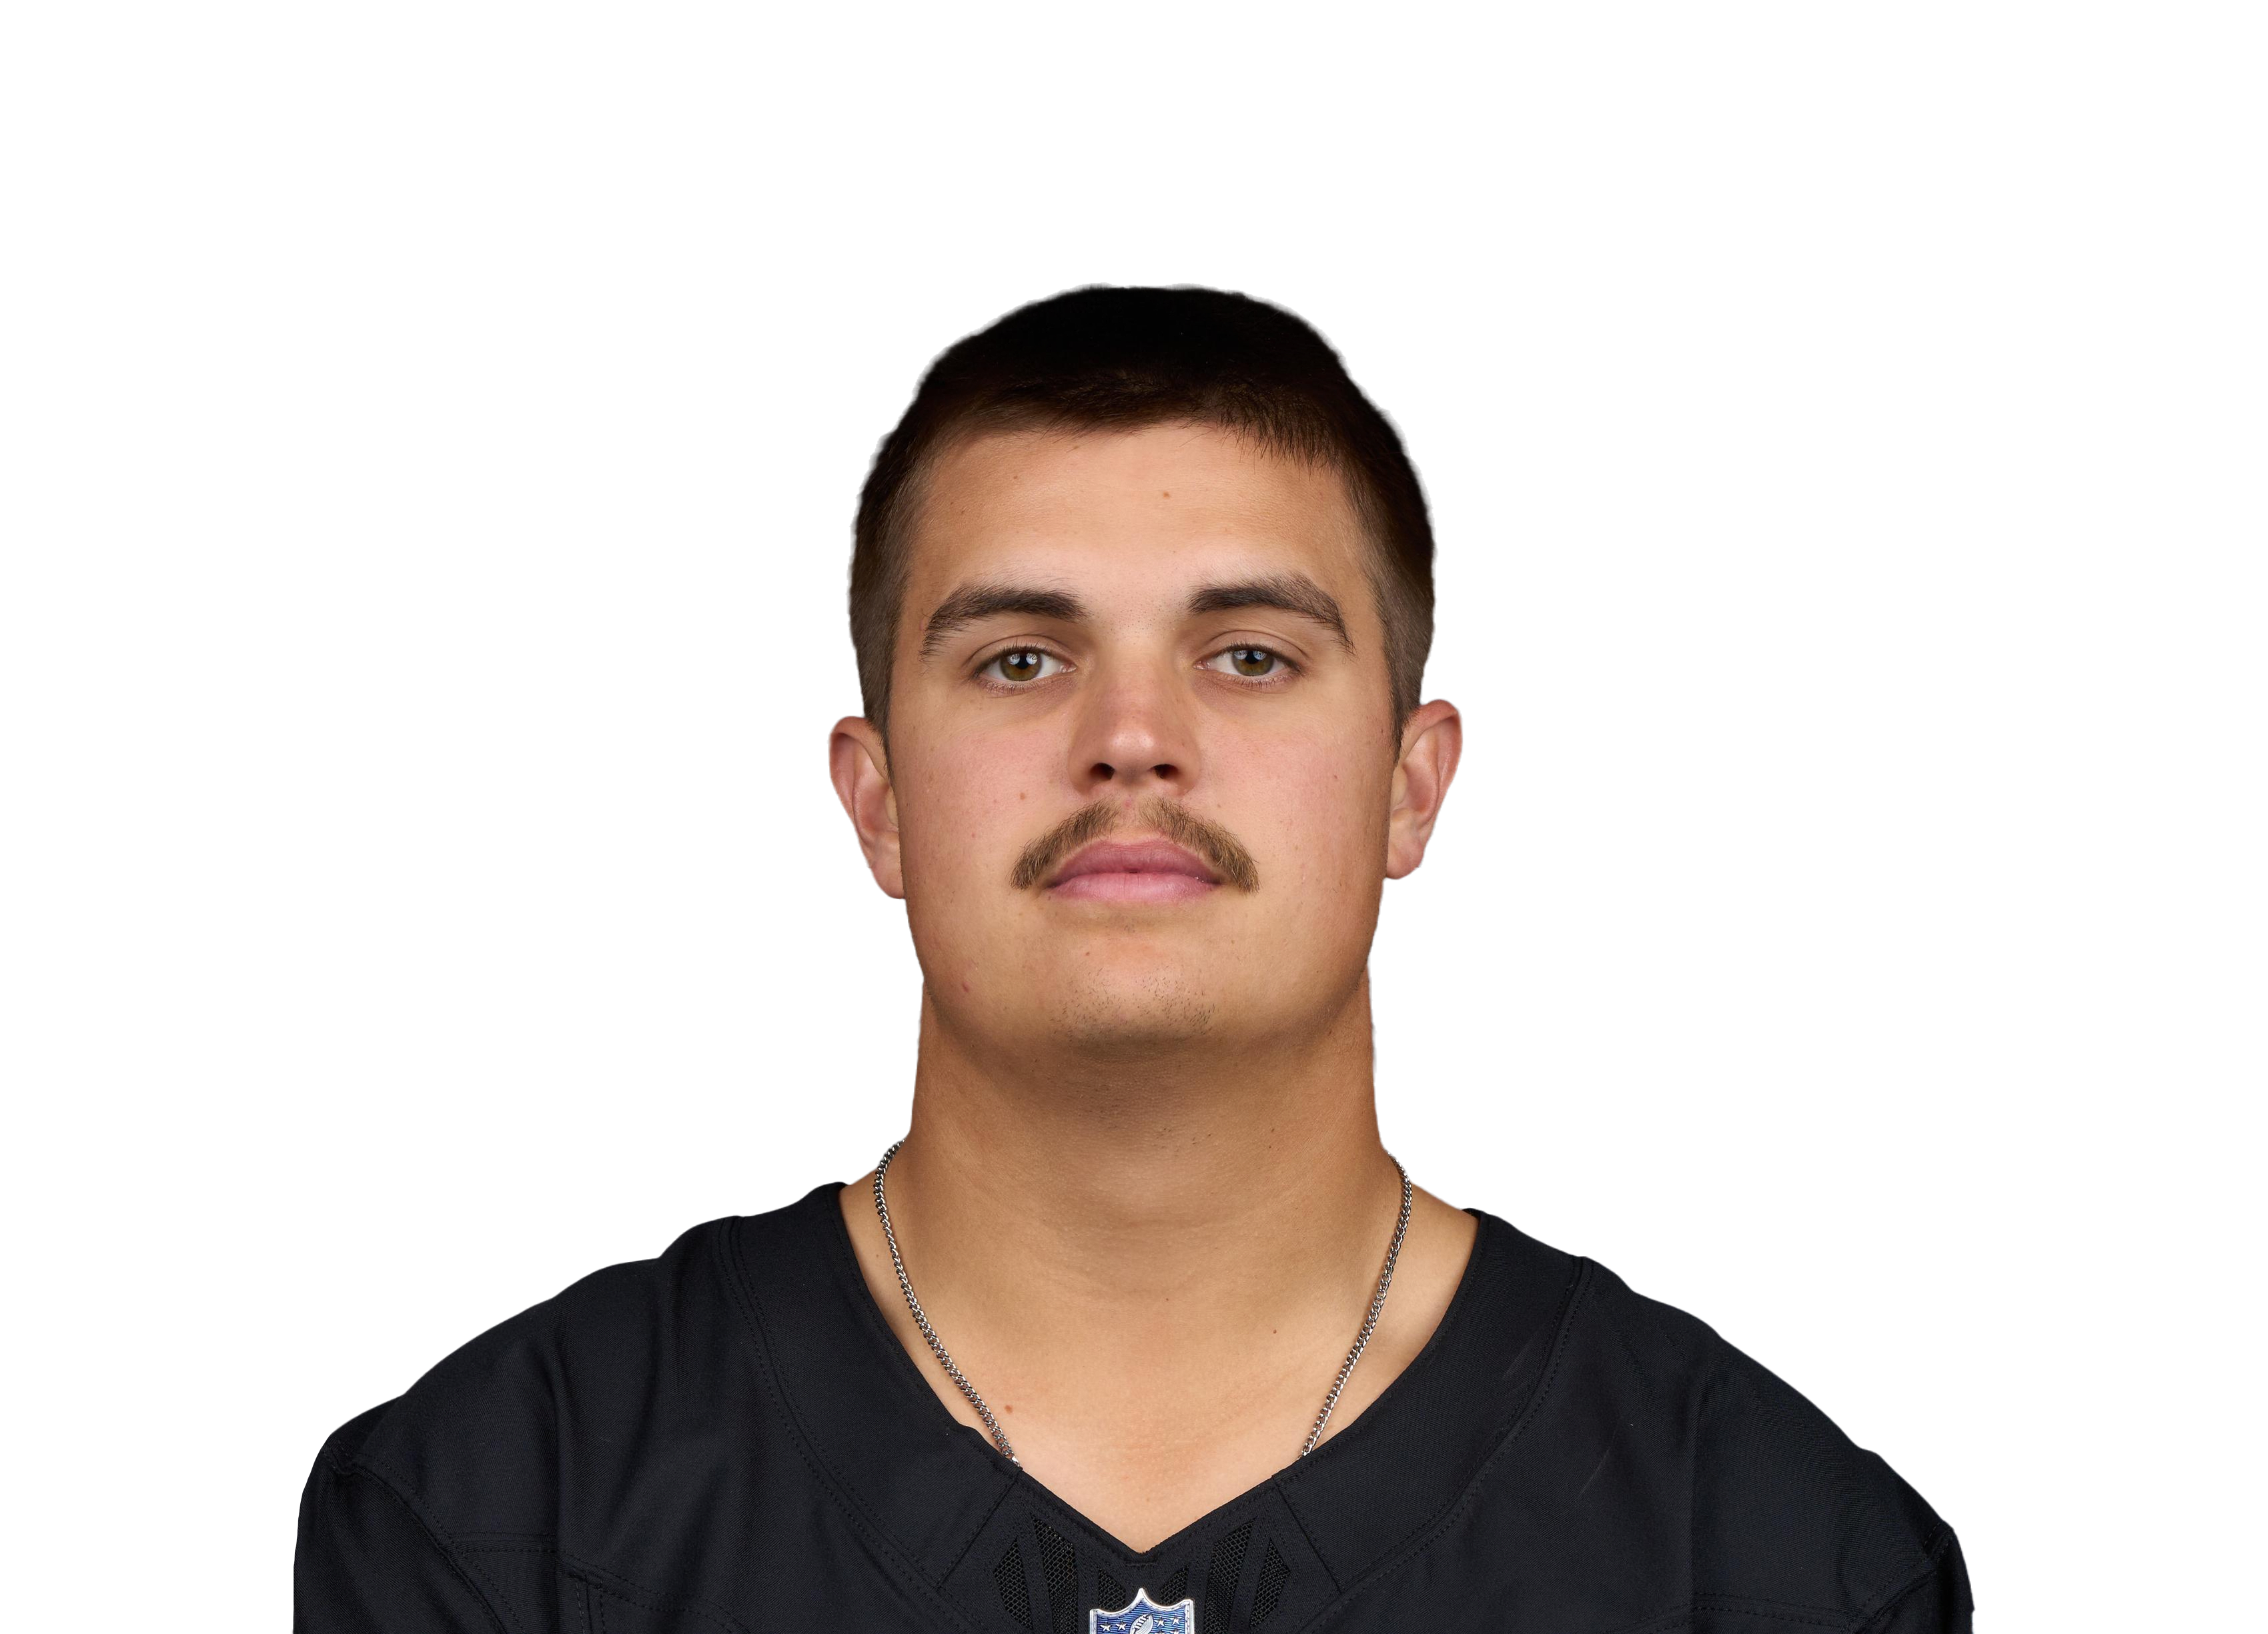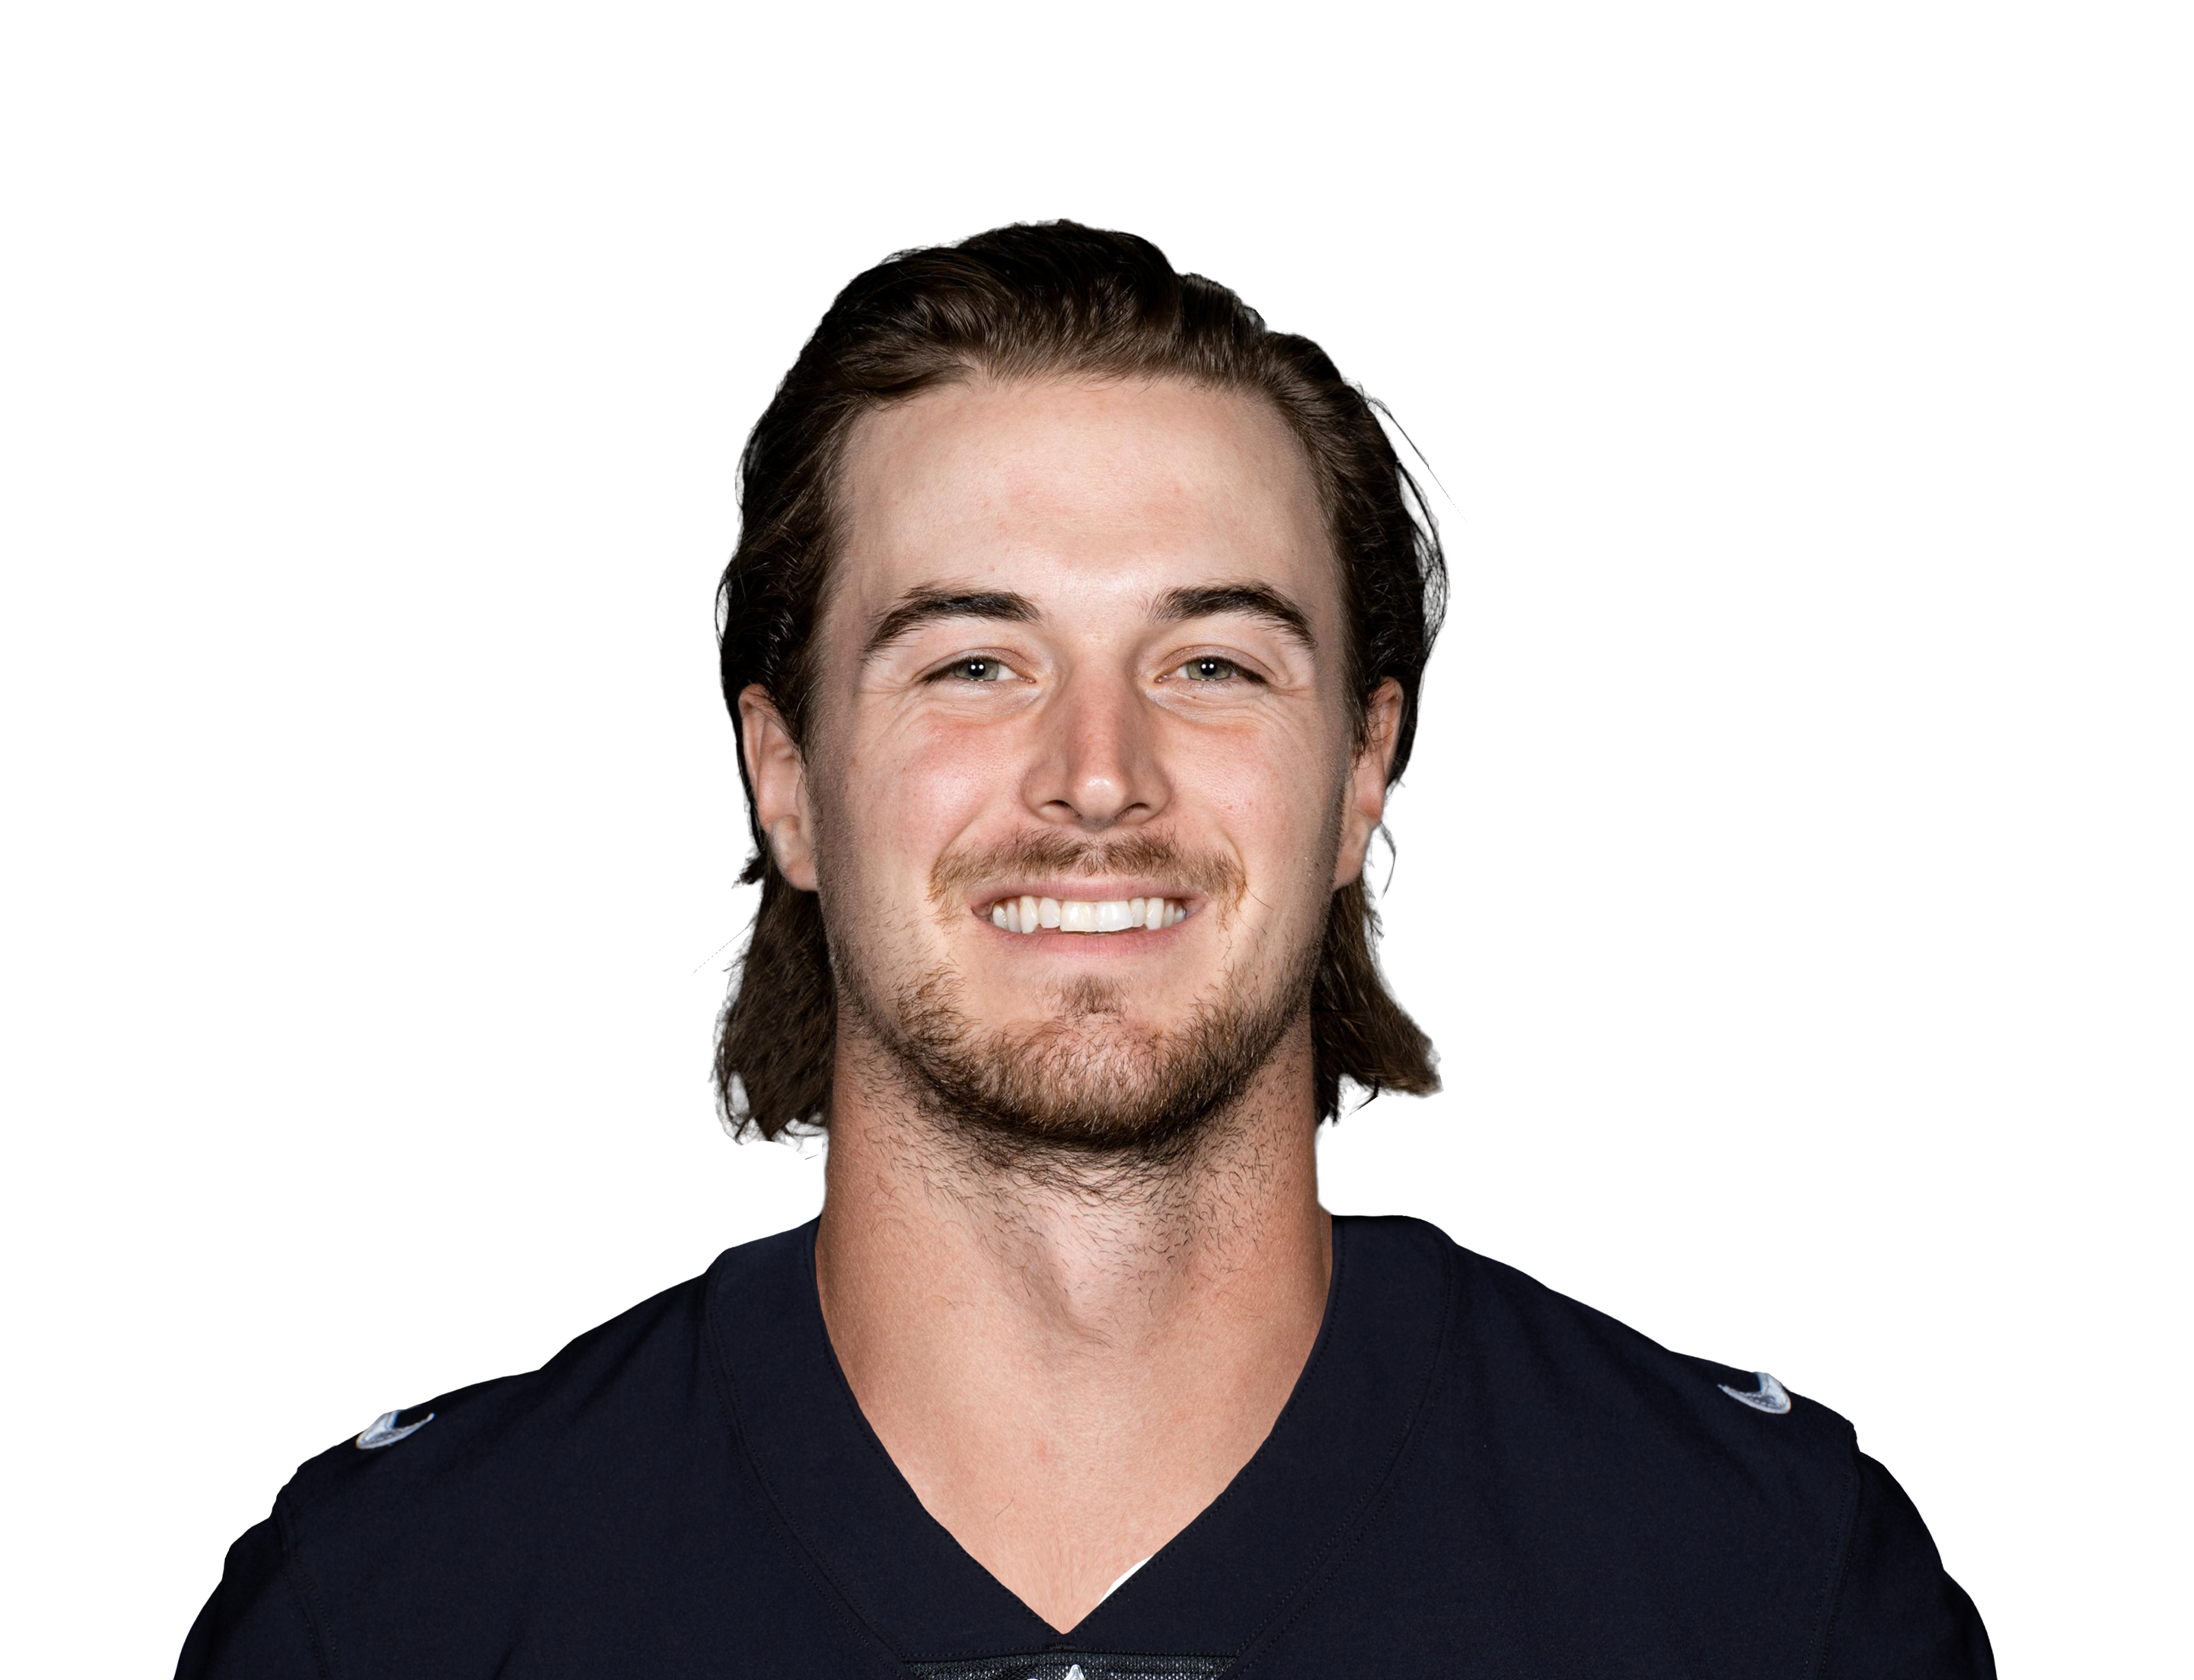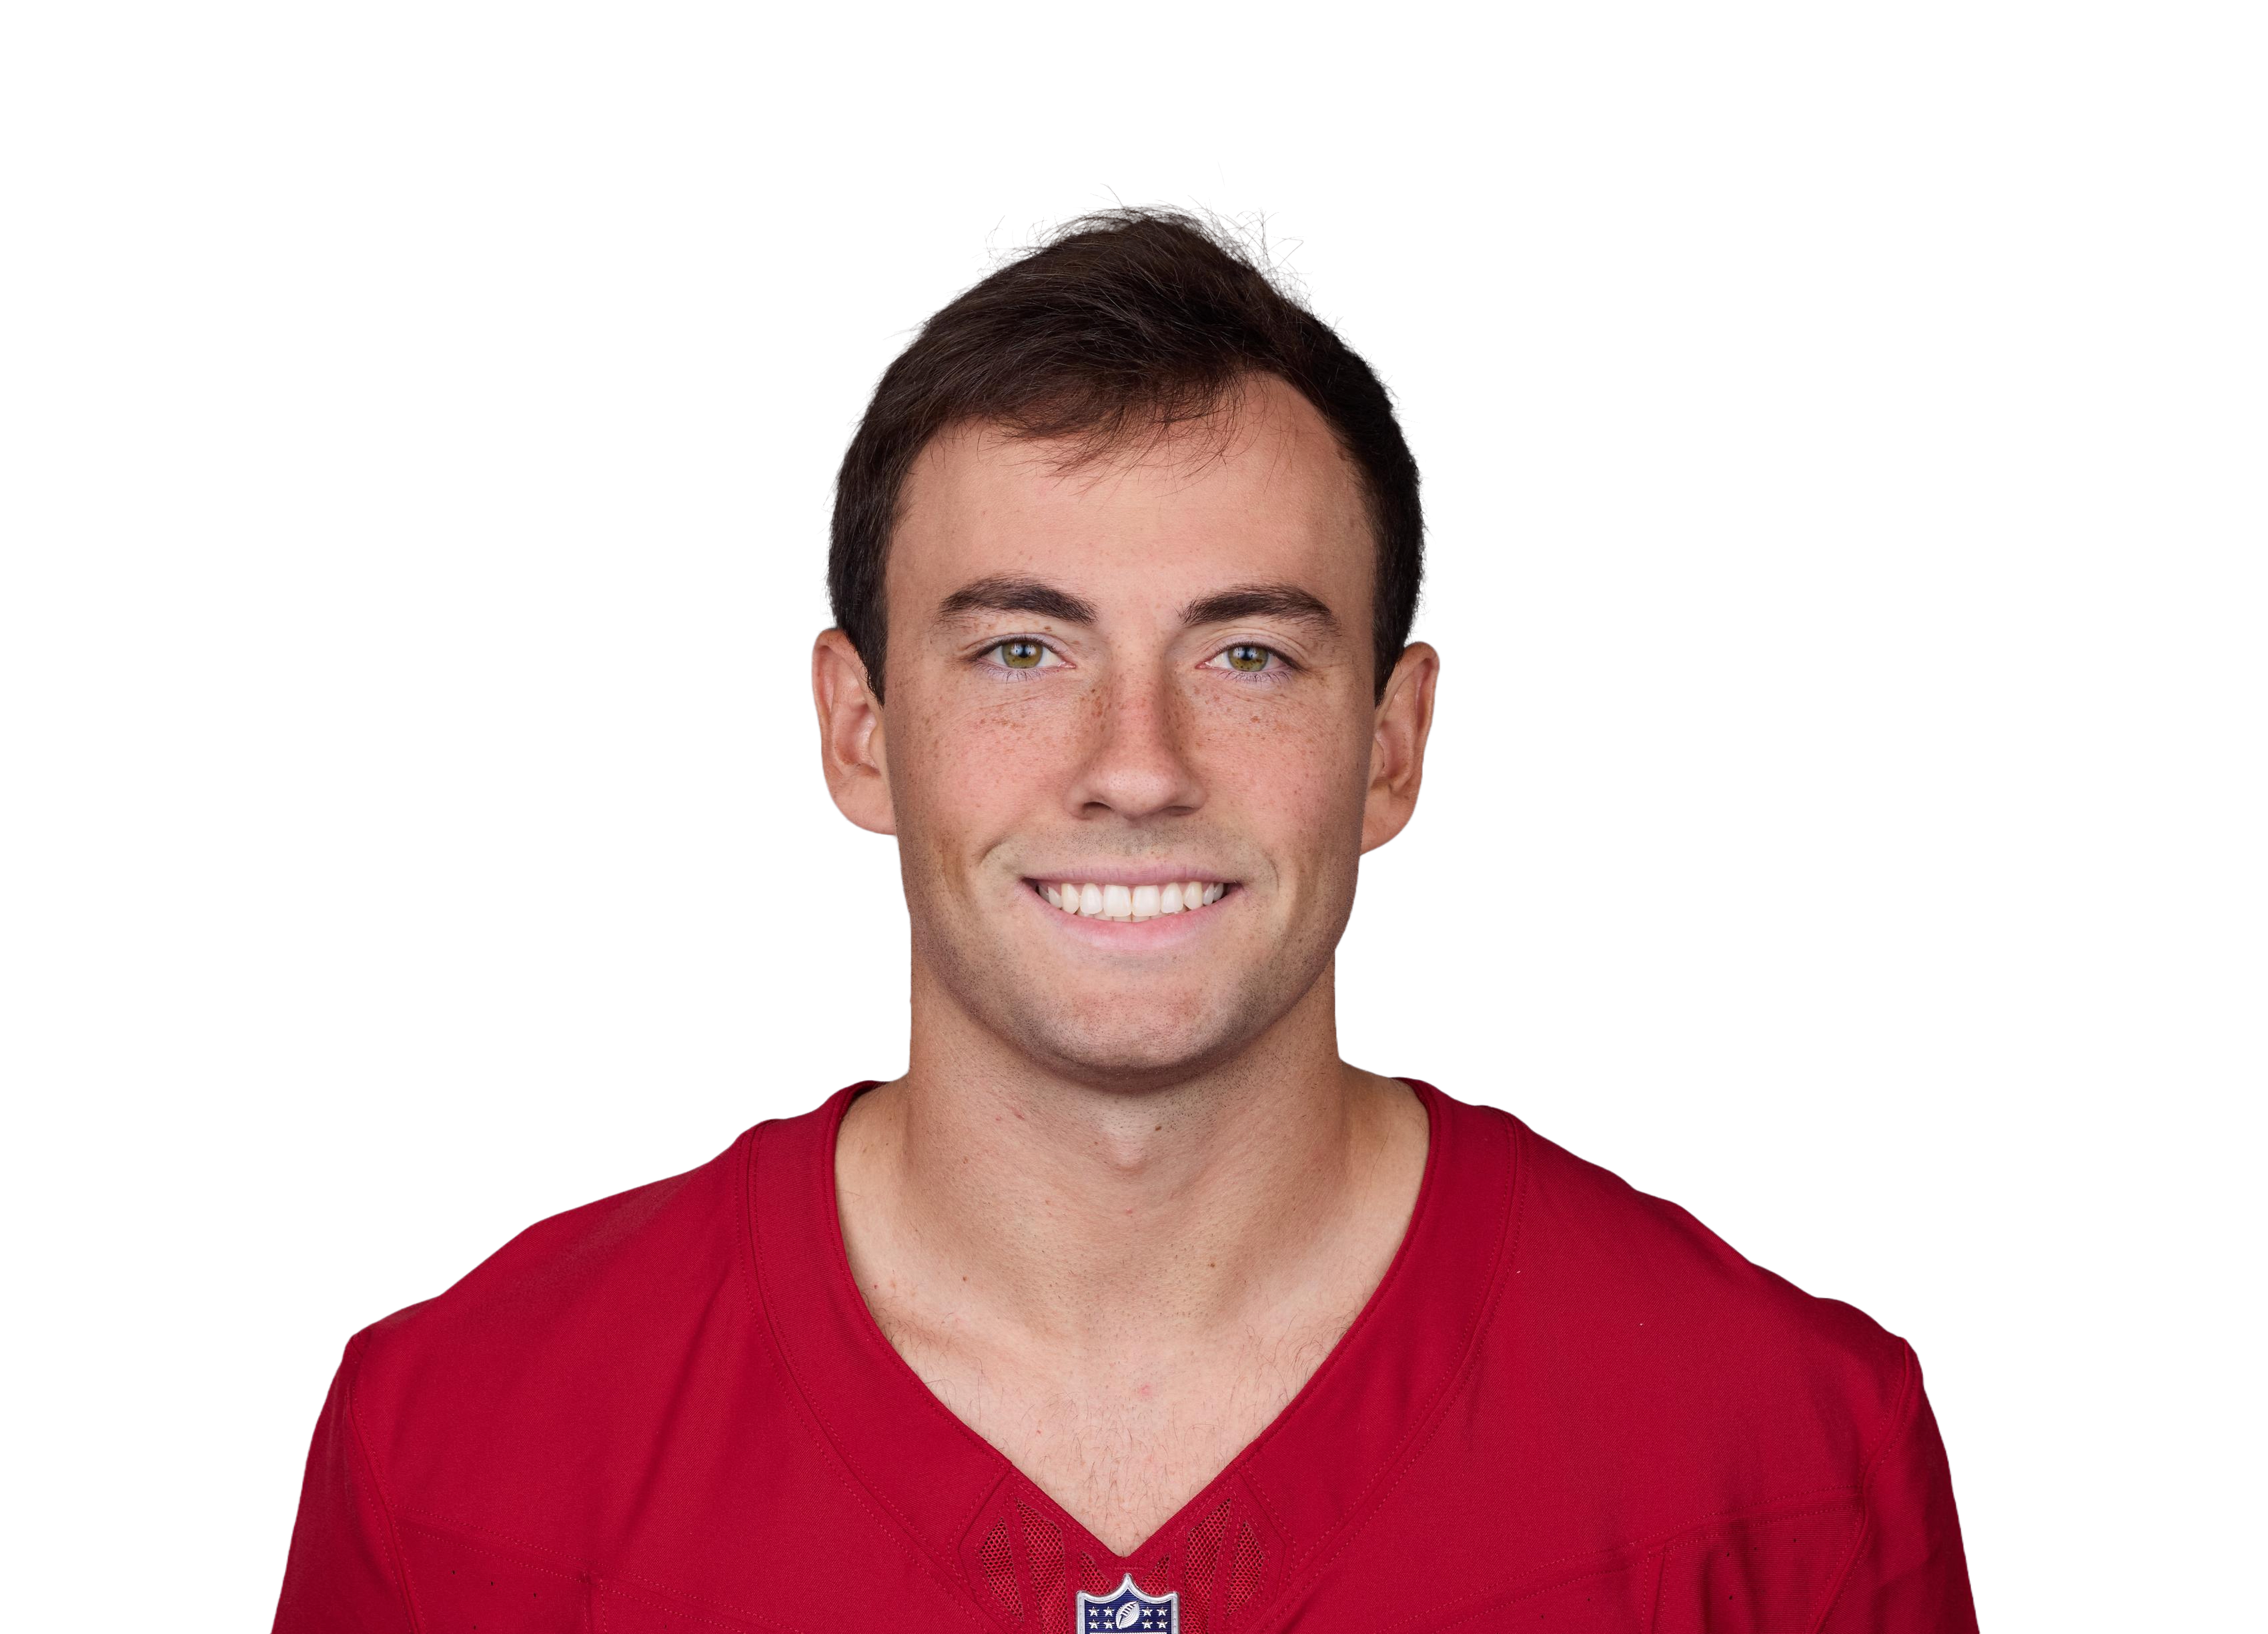

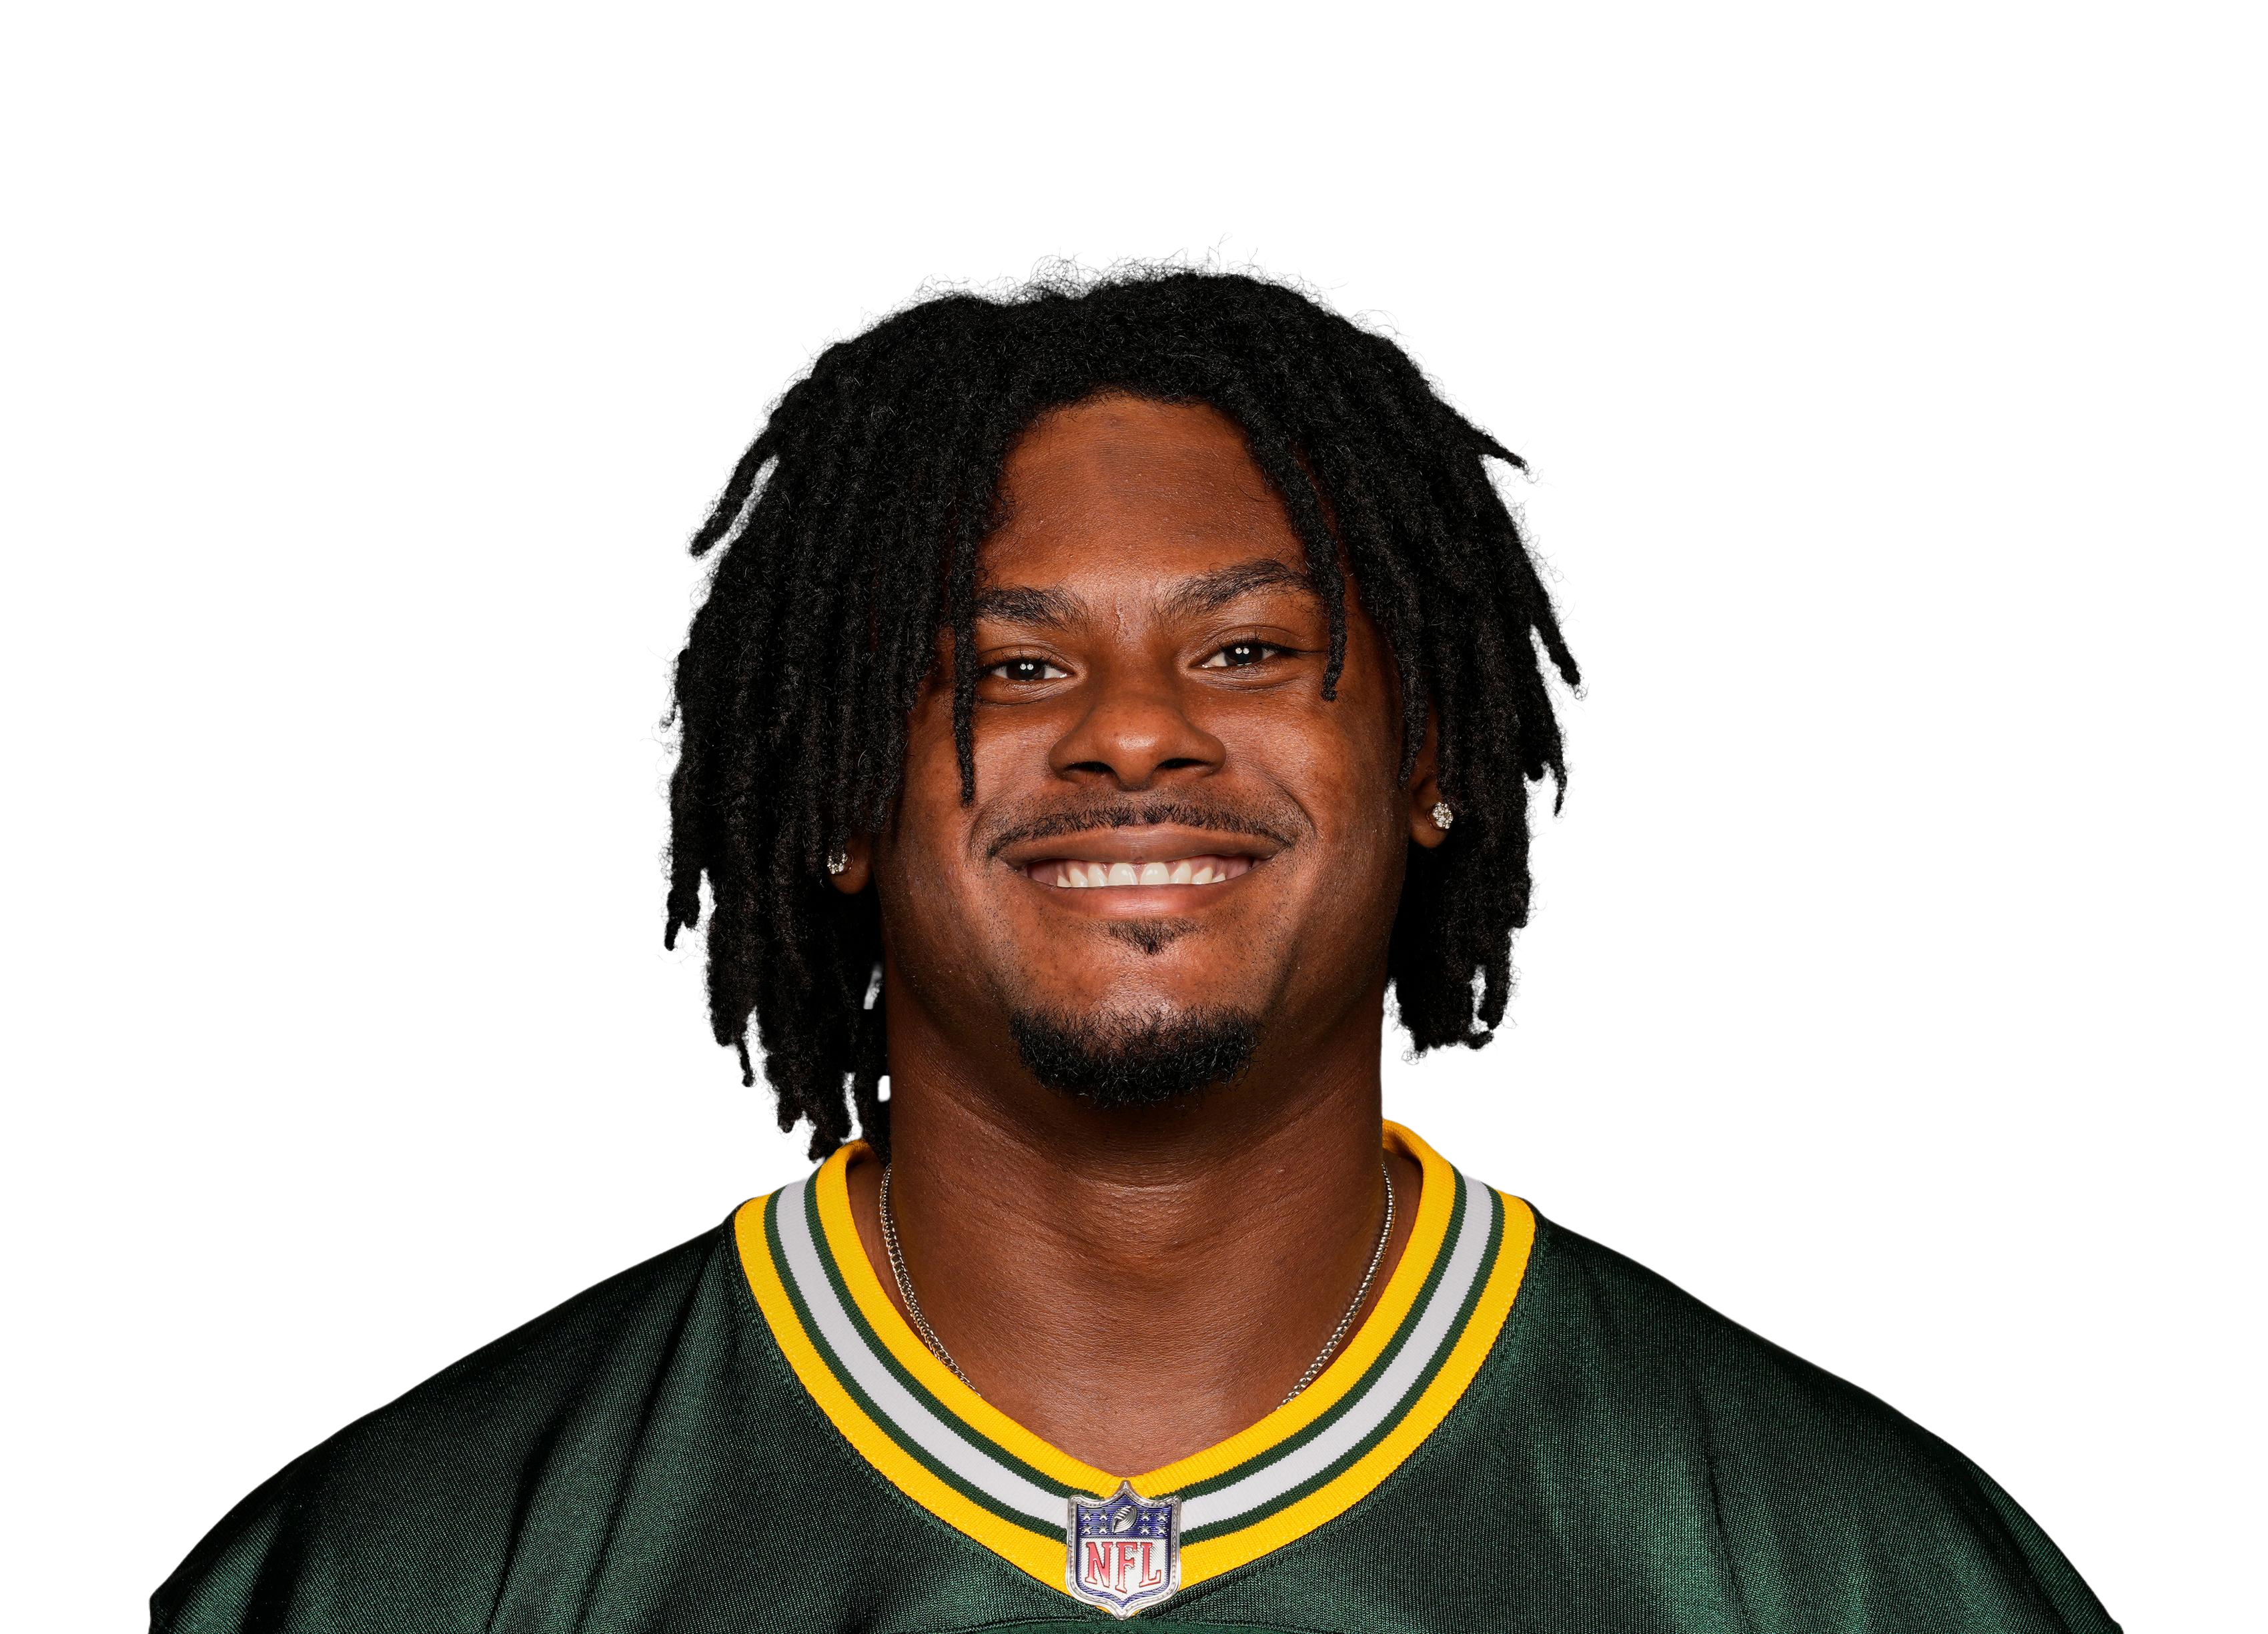
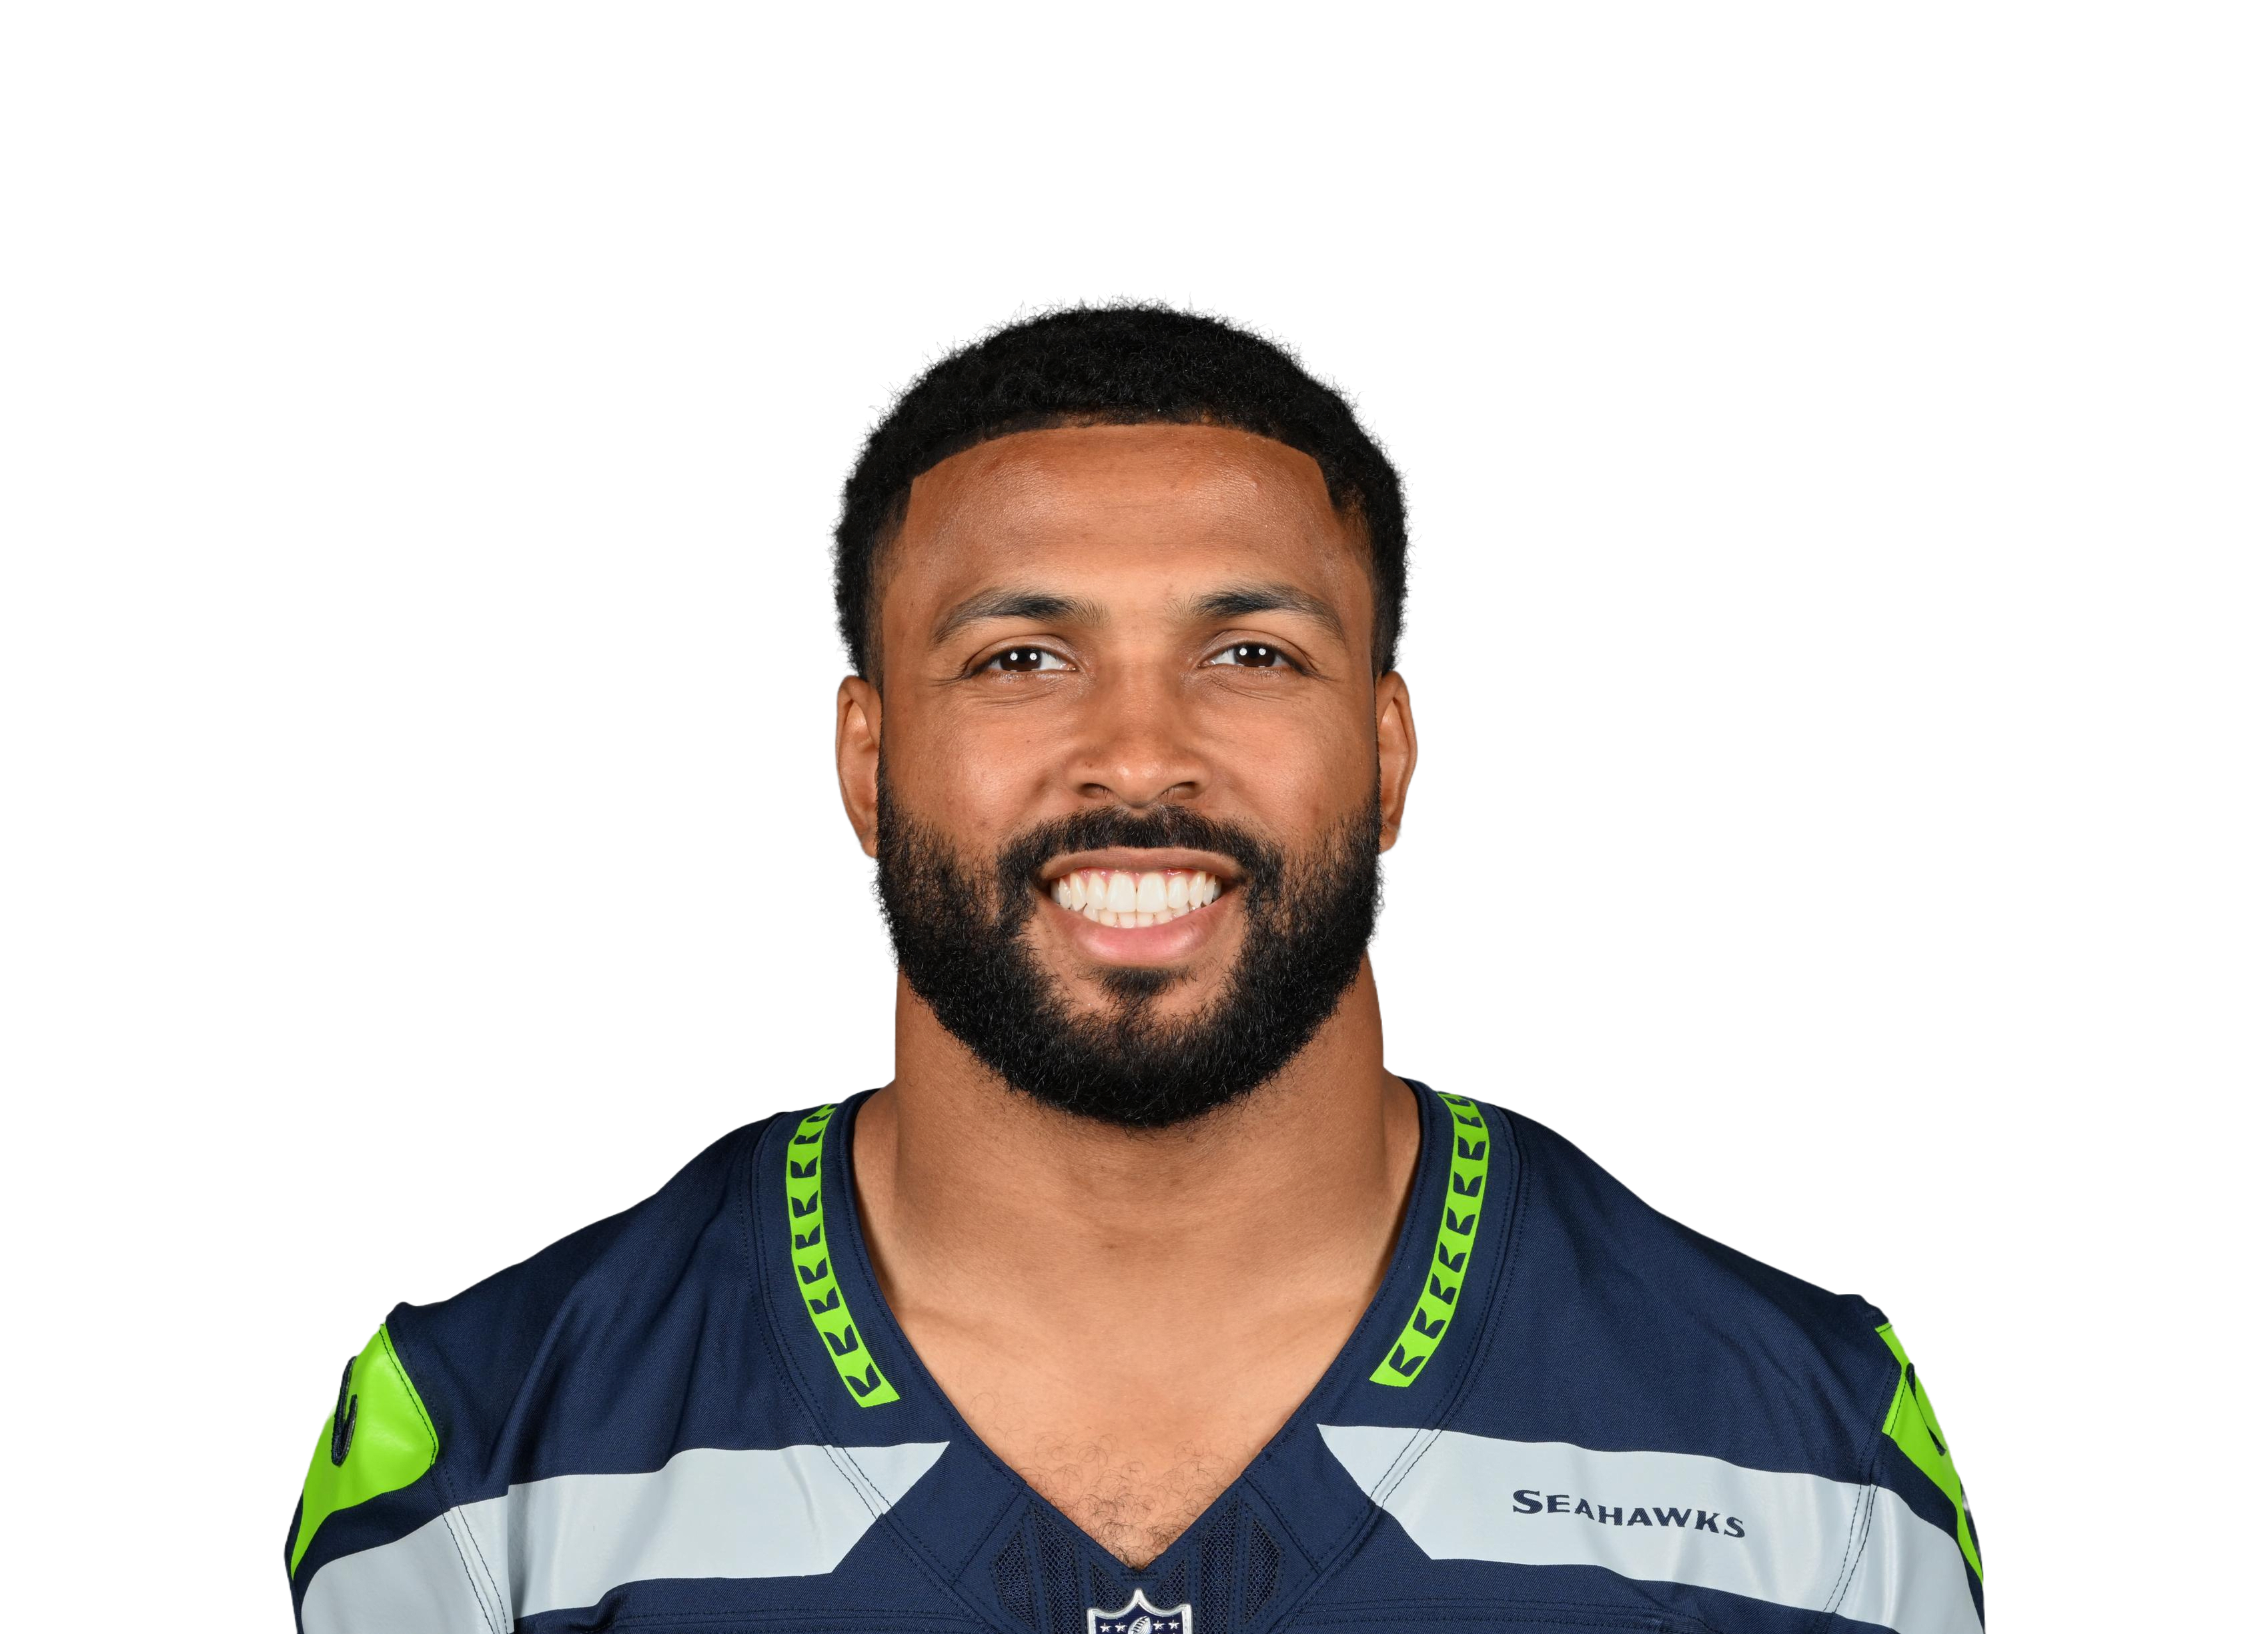
QB EPA leaders rank quarterbacks by expected points added per dropback. Higher EPA/play means more efficient offense — useful for fantasy QB streaming and identifying breakout passers beyond raw yardage.

QB EPA Leaders

67 players · 2025
# Player Team EPA/play Att Yds EPA
1 M.Willis GB
0.739
38 407 28.1
2 M.Trubisky BUF
0.696
37 315 25.7
3 J.Love GB
0.253
508 3538 128.7
4 J.Winston NYG
0.223
69 556 15.4
5 M.Stafford LA
0.221
741 5446 164.1
6 D.Maye NE
0.175
681 4888 119.3
7 J.Goff DET
0.174
614 4305 107.1
8 D.Prescott DAL
0.165
630 4348 104.1
9 S.Darnold SEA
0.145
599 4487 86.8
10 D.Jones IND
0.139
409 2945 56.9
11 J.Allen BUF
0.130
584 3899 75.9
12 P.Mahomes KC
0.127
537 3398 68.4
13 B.Purdy SF
0.127
359 2497 45.6
14 M.Jones SF
0.117
308 2049 35.9
15 J.Burrow CIN
0.099
278 1696 27.6
16 B.Nix DEN
0.090
684 4099 61.4
17 J.Johnson WAS
0.082
54 358 4.4
18 C.Williams CHI
0.082
686 4390 56.2
19 M.Rudolph PIT
0.068
55 300 3.8
20 T.Lawrence JAX
0.053
631 3965 33.5
21 J.Hurts PHI
0.043
522 3210 22.4
22 C.Wentz MIN
0.034
188 1093 6.4
23 J.Flacco CIN
0.032
264 1604 8.6
24 K.Murray ARI
0.032
177 851 5.7
25 T.Huntley BAL
0.031
74 388 2.3
26 C.Stroud HOU
0.030
531 3289 15.8
27 J.Milton DAL
0.026
24 183 0.6
28 L.Jackson BAL
0.020
338 2312 6.9
29 T.Tagovailoa MIA
0.019
415 2467 8.0
30 M.Penix ATL
-0.004
290 1883 -1.1
31 B.Mayfield TB
-0.006
584 3463 -3.4
32 M.Mariota WAS
-0.008
244 1590 -1.9
33 J.Brissett ARI
-0.012
530 3080 -6.3
34 J.Herbert LAC
-0.015
603 3546 -8.8
35 J.Dart NYG
-0.021
375 2122 -7.8
36 A.Rodgers PIT
-0.022
564 3254 -12.5
37 K.Cousins ATL
-0.023
281 1642 -6.4
38 T.Shough NO
-0.028
356 2189 -10.0
39 J.Daniels WAS
-0.029
204 1183 -5.9
40 T.McKee PHI
-0.053
46 260 -2.5
41 B.Young CAR
-0.054
548 3061 -29.8
42 Q.Ewers MIA
-0.061
91 563 -5.6
43 T.Taylor NYJ
-0.090
147 697 -13.2
44 J.Fields NYJ
-0.093
233 1056 -21.7
45 D.Mills HOU
-0.099
169 857 -16.7
46 P.Rivers IND
-0.115
97 507 -11.2
47 R.Wilson NYG
-0.121
129 765 -15.7
48 A.Dalton CAR
-0.126
45 239 -5.7
49 S.Rattler NO
-0.132
272 1482 -35.9
50 G.Smith LV
-0.146
503 2622 -73.6
51 C.Ward TEN
-0.192
592 2759 -113.5
52 J.McCarthy MIN
-0.198
273 1485 -54.1
53 R.Leonard IND
-0.217
70 398 -15.2
54 D.Gabriel CLE
-0.220
204 810 -44.8
55 A.O'Connell LV
-0.255
23 97 -5.9
56 S.Sanders CLE
-0.299
235 1236 -70.2
57 J.Flacco CLE
-0.344
168 761 -57.7
58 J.Browning CIN
-0.395
134 711 -52.9
59 B.Cook NYJ
-0.395
173 616 -68.3
60 J.Stidham DEN
-0.457
34 102 -15.5
61 C.Rush BAL
-0.473
53 287 -25.1
62 C.Oladokun KC
-0.483
62 142 -30.0
63 K.Pickett LV
-0.550
52 134 -28.6
64 T.Lance LAC
-0.651
59 182 -38.4
65 M.Brosmer MIN
-0.689
85 228 -58.5
66 B.Allen TEN
-0.775
31 65 -24.0
67 C.Tune GB
-0.995
20 -2 -19.9

QB EPA FAQ

What is EPA per play for QBs?

Expected Points Added per play measures how much a quarterback improves his team's scoring expectation on each dropback versus an average play.

How should fantasy managers use QB EPA?

Pair high EPA/play with volume (attempts). Efficient QBs with rising snap or attempt share are strong streamers and DFS pivots.

How is this different from passing yards leaders?

Passing yards reward volume. EPA rewards efficiency. Use NFL Stat Leaders for yards and touchdowns; use Football Deep Dive for process quality.

Guide · NFL · FantasyHQ

QB EPA Leaders — What It Measures

Understand quarterback EPA per play with FantasyHQ data. Use EPA leaders to spot efficient passers for fantasy and DFS.

EPA (Expected Points Added) measures how much each play improved (or hurt) a team's scoring outlook. View QB EPA leaders by season.

Why fantasy managers care

High EPA quarterbacks sustain drives and pile up yards — even without always throwing TDs. Pair EPA trends with fantasy QB rankings to find market inefficiencies.

EPA is context-aware: a 3-yard gain on 3rd-and-2 scores higher than 3 yards on 3rd-and-10.